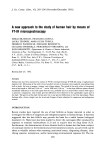
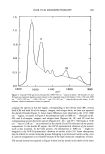
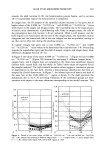
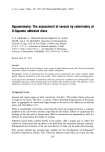
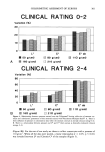
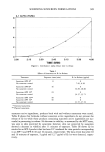
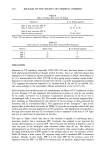
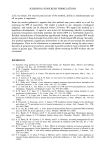
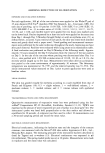
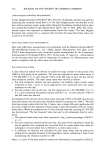
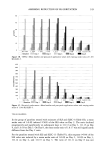
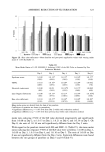
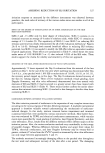
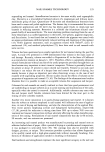
ASSESSING REDUCTION OF SLS IRRITATION 319 30 SLS 1.0% 1 0 08 Baseline :½• Day 1 I 1 0 10 1 ' 0 13 1 ß 0 17 1 ' 0 25 1 ß 0 50 1 ß 1 00 SLEC-5 1 6% ,' • Day 2 %• Day 3 • Day 4 • Day 5 Figure lB. TEWL--Mean baseline and post-patch application values with varying molar ratios of 1.0% SLS:SLEC-5. 1 lOO lOOO 9oo 8oo 03 700 c- • 600 o 500 ._ E 4o0 300 2OO lOO SLS 1.0% 1 ß 0.08 1 '010 0.13 1'017 1 '0.25 1 .050 1 ' 1 00 SLEC-5 1 6% •__J Baseline • Day 1 • Day 2 ,• Day 3 • Day 4 • Day 5 Figure 1C. Electrical conductance•Mean baseline and post-patch application values with varying molar ratios of 1.0% SLS:SLEC-5. VISUAL GRADING In the group of panelists treated with mixtures of SLS and SLEC-5 (Table III), a mean molar ratio of 1:0.09 induced •50% of the SLS value on Day 2. The ratio declined progressively and significantly on subsequent days to 1:0.13 on Day 3, 1:0.15 on Day 4, and 1:0.18 on Day 5. On Day 8, the mean molar ratio of 1:0.17 was still significantly different from the Day 2 ratio. For the panelists treated with SLS and SLEC-13 (Table IV), skin response •50% of the SLS value was induced by a mean molar ,ratio of 1:0.09 on Day 2, 1:0.09 on Day 3, 1:0.12 on Day 4, and 1'0.15 on Day 5. The ratio of 1:0.11 on Day 8 was not

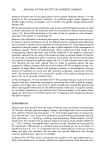
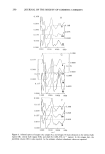
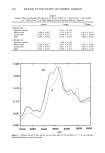
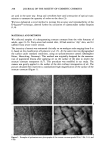
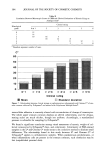
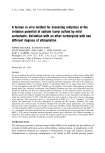
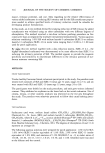
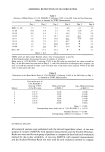
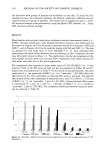
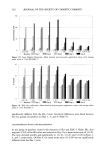
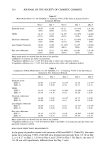
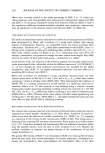
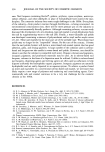
320 JOURNAL OF THE SOCIETY OF COSMETIC CHEMISTS 150 '•: 100 -- ._ .-=- 50 SLS10% 1:0.08 1 .0.10 1:0.13 1'0.17 1:0.25 1:0.50 1'100 SLEC-51.6% Baseline • Day 1 '• Day 2 • Day 3 • Day 4 • Day 5 Figure 1D. Laser Doppler flowmetry--Mean baseline and post-patch application values with varying molar ratios of 1.0% SLS:SLEC-5. SLS 1.0% 1 ' 0.08 1 ' 0.10 Baseline ,• Day 1 '0.13 Day 2 1:017 1 '0.25 1 .0.50 1 '1.00 SLEC-51.6% • Day 3 • Day 4 • Day 5 Figure 1E. Skin color reflectancesMean baseline and post-patch application values with varying molar ratios of 1.0% SLS:SLEC-5. significantly different from the Day 2 ratio. Statistical differences were found between the two groups of panelists on Days 3, 4, and 8 (Table V). TRANSEPIDERMAL WATER LOSS MEASUREMENTS In the group of panelists treated with mixtures of SLS and SLEC-5 (Table III), skin response •50% of the SLS value was induced on Day 2 by a mean molar ratio of 1:0.10. The ratio declined steadily and significantly to 1:0.16, 1:0.20, and 1:0.28 on Days 3, 4, and 5, respectively. On Day 8, the mean molar ratio of ! :0.09 was not significantly different from the Day 2 ratio.
Purchased for the exclusive use of nofirst nolast (unknown)
From: SCC Media Library & Resource Center (library.scconline.org)