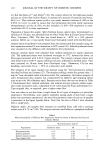
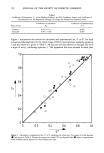
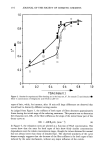
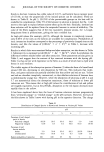
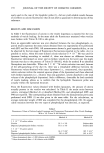
122 JOURNAL OF THE SOCIETY OF COSMETIC CHEMISTS of t-RA like Retin-A TM and Aberel © (16). The control vehicle for the high-dose studies and one set of low-dose studies (Figure 3) consisted of a mixture of transcutol and water, 68:32 v:v. This cosolvent system yields a very nearly saturated solution of t-RA at the 0.05% w:v level. In order to ensure that this formulation did yield nearly maximum thermodynamic activity of t-RA, we also included a 0.10% t-RA suspension in trans- cutol/water 68:32 in some experiments. Preparation of human skin samples. Split-thickness human cadaver skin, dermatomed to a thickness of 250 •tm, was obtained from the Ohio Valley Skin 8: Tissue Center (Vernon Place, Cincinnati, OH). The skin was stored frozen at -80øC in a 10% glycerol solution. Before use, it was rapidly thawed and thoroughly rinsed with distilled water. Isolated sheets of epidermis were prepared from the dermatomed skin samples using the heat separation method (2-min immersion in 60øC water) (26). Isolated epidermal sheets were mounted on the diffusion cells immediately after preparation. Stratum corneum sheets were prepared from isolated epidermis by trypsin digestion (26). The epidermal sheets were incubated overnight at 37øC, dermal side down, on filter paper saturated with 0.01% trypsin solution. The stratum corneum sheets were then rinsed with a 0.007 % trypsin inhibitor solution, followed by distilled water. They were mounted on 20-mm drain discs (Nuclepore Corp., Pleasanton, CA) for easy handling, and stored dry at -20øC in a dessicator until needed. The integrity of all tissue samples was assessed using the 3H20 permeation method described by Franz and Lehman (27). The samples yielding a water flux greater than 1.2 mg/cm 2 were discarded unless otherwise noted. For comparison, the barrier integrity of some dermatomed skin samples was compromised by adhesive tape-stripping (about nine strips with 3M cellophane tape). Example results from that test are shown in Table I. Dermatomed skin, isolated epidermis, and isolated stratum corneum yielded equiv- alent water permeation rates, comparable to the values found by Franz and Lehman (27). Tape-stripped skin, as expected, gave a higher water flux. Care was taken to use skin from a single donor for all types of samples in a particular experiment. Nevertheless, since quality variability among packs of skin from a single donor was sometimes experienced, the water flux geometric mean of each set of samples is presented in the figure legends below. Note that the data in Table I were obtained from a single pack. Diffusion studies. All samples were mounted on modified Franz cells with a nominal surface area of 0.79 cm 2 (28). The receptor solution was Dulbecco's phosphate-buffered Table I Water Permeability of Different Skin Preparations From One Donor as Measured by Franz and Lehman's Method 3H20 penetration, mg/cm 2 Preparations Geometric mean SE n Dermatomed skin 0.27 0.04 7 Isolated epidermis 0.27 0.04 7 Isolated stratum corneum 0.21 0.07 10 Tape-stripped skin 1.34 0.22 7

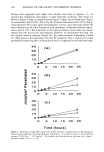
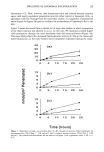
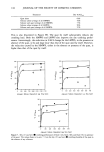
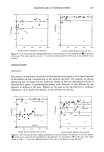
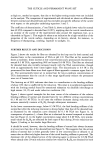
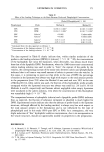
INFLUENCE OF LIPOSOMAL ENCAPSULATION 123 saline, pH 7.4, containing 0.02% (w:v) sodium azide to retard microbial growth. The receptor solutions were stirred and maintained at 37øC in thermostated aluminum blocks, yielding a skin surface temperature of 30-32øC. To improve sensitivity, we ranked the tissue samples in order of increasing water permeability, and applied each formulation to at least seven samples using a random complete block design (29). Most of the diffusion studies employed small, non-occluded topical doses (3.8 •1, 4.8 mg/ cm 2, herein called "small dose"), similar to those achieved by application of a skin cream or moisturizer. Other studies employed much higher doses (160 •1, 200 mg/cm 2, herein called "large dose") to provide a comparison with the work of other investigators (10-13). To identify purely thermodynamic effects in these studies, the formulations were also applied to a silicone rubber membrane (Silastic © membrane, Dow Corning). The membrane thickness was 410 -+ 19 •m (mean -+ SD of eight determinations). Receptor solutions were collected for radiochemical assay after elapsed times of 2, 4, 7, and 24 hours, and the cells refilled with fresh buffer. Samples were analyzed for 3H activity by liquid scintillation counting (Packard Model 1900 TR), using a maximum counting time of 5 min per sample. Statistical analysis. Results were reported as either cumulative amount or cumulative percent-of-dose of t-RA penetrated at each time point. Statistical comparisons were made using PROC GLM in SAS Vers. 6.06 (SAS Institute Inc., Cary, NC). To compare data from different treatments applied to the same type of tissue, we performed a two-way analysis of variance on logarithmically transformed data, blocking on water permeability (29). To compare penetration through the different skin preparations, we performed a one-way analysis of variance on the log-transformed data. The potential for liposome-induced accumulation of t-RA in the lower layers of the skin was assessed in two ways. The first was to directly compare the penetration rates of liposomal t-RA through skin samples of varying thickness. This method was used when all skin samples from a donor had comparable water permeabilities (Figures 1, 2). The second method, used for samples having different water permeabilities (Figures 3-5), was to form the ratio between the amount of t-RA penetrated through stratum corneum to that through dermatomed skin. A significantly higher value (Student's t-test) of this ratio for lipo- some-encapsulated active versus non-encapsulated active was taken as evidence for li- posome-induced accumulation of t-RA in the skin. RESULTS LIPOSOME SIZE DISTRIBUTION The size distribution modes for four different systems--PC, PC/t-RA, PC/PE/OA/ CHEMS, and PC/PE/OA/CHEMS/t-RA--are reported in Table II. For the empty PC liposomes, the mode of the number distribution was about half the pore size used for extrusion. These results are somewhat smaller than those obtained by Mayer et al. (24), but they are consistent with their conclusion that different size distributions can be obtained by using different pore sizes. The distribution modes for the empty PC/PE/ OA/CHEMS liposomes were lower (about one fourth of the pore diameter instead of one half). However, there was still a strong positive correlation between distribution mode and pore size. Incorporation of t-RA into these systems totally changed the size distri-
Purchased for the exclusive use of nofirst nolast (unknown)
From: SCC Media Library & Resource Center (library.scconline.org)