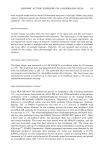
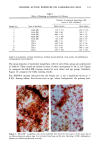
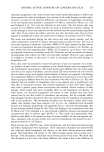
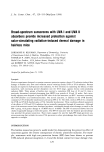
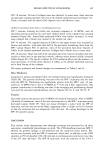
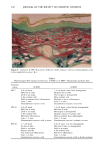
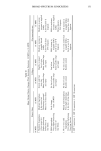
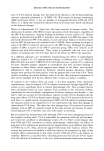
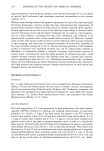
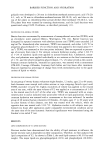
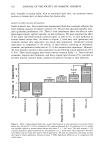
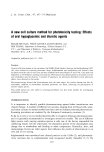
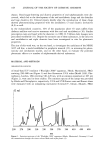
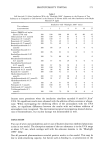
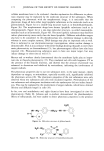
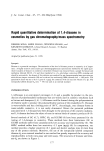
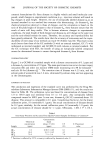
DETERMINATION OF DIOXANE LEVELS 181 Table II Inter-Assay Precision and Reproducibility From Quality Assurance Samples for Dioxane in Cosmetics* Theoretical Concentration concentration (mean - S.D.) CV % Theoretical Time Sample (ppm) (ppm) (%) value Second day QA 5.0 4.94 - 0.31 6.3 99 6 Third day QA 5.0 5.17 - 0.27 5.2 103 6 * Precision is reflected by CV% reproducibility is reflected by theoretical value %. That is why in the low concentration range (0.1 to 1.0 ppm) the calibration curve is not linear. The background noise of m/z 88 would give the same effect at times, even if the dioxane-d 8 were 100% pure. In the high concentration range, the factor of 0.1 ppm would have a negligible effect. That is why the calibration curve is linear at concen- trations from 1.0 to 100 ppm. However, the DM-LIMS program can yield a very good fit for the whole calibration range (0.1-100 ppm), using the nonlinear regression (see Table III and Figure 3). This feature was also used and discussed in detail in our previous •bundance 50000 45000 40000 35000 30000 25000 20000 15000 10000 5000 dioxane-D8 m/z=96 dioxar. m/z=S S 0 Time-- '' '4.'00''' '4.'20''' '4.'40 .... 4.'60 ' ' ' '4.'80 .... 5.i00 .... ' Figure 2. A GC/MS chromatogram of a dioxane standard sample.

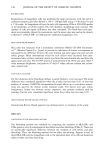
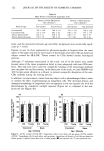
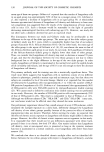
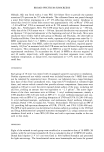
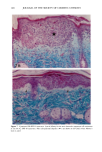
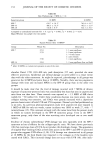
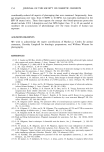
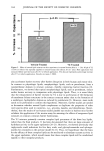
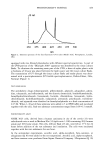
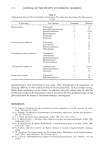
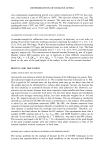
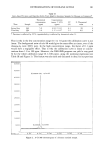
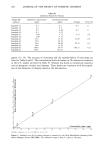
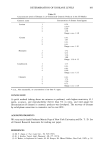
182 JOURNAL OF THE SOCIETY OF COSMETIC CHEMISTS Table III Calibration Results for Dioxane Sample ID/ Calibration concentration Concentration found replicate (ppm) (ppm) Average Error (%) Standard-1/1 0.1 0.1 0.1 0 Standard-1/2 0.1 0.1 Standard-2/1 0.5 0.48 0.5 0 Standard-2/2 0.5 0.52 Standard-3/1 5.00 5.12 5.12 2.4 Standard-3/2 5.00 5.12 Standard-4/1 25.0 23.26 24.90 0.4 Standard-4/2 25.0 26.54 Standard-5/1 50.0 48.80 50.15 0.3 Standard-5/2 50.0 51.49 Standard-6/1 100.0 99.41 100.21 0.21 Standard-6/2 100.0 101.01 papers (12-14). The accuracy of intra-assay and the reproducibility of inter-assay are listed in Tables I and II. The concentration levels ofdioxane in 20 commercial cosmetics in the U.S. market are listed in Table IV. Dioxane was found in commercial cosmetics such as shampoos, lotions, and cleansers. These results are consistent with the hypoth- esis of the formation of dioxane stated in the introduction. 3- 2- 1- S6 • Concentration ( ppm: •g/g) 0 , S2 0 1'0 2'0 3'0 4'0 5'0 6'0 7•0 8'0 9•0 1 • 0 DMLIMS+ Version 4.3.1a [14-MAY-96 10:33:30] Figure 3. Standard curve fit for analyte dioxane in cosmetics by the Drug Metabolism Laboratory Infor- mation Manager System (DM-LIMS). The calibration range is from 0. ! ppm to !00 ppm.
Purchased for the exclusive use of nofirst nolast (unknown)
From: SCC Media Library & Resource Center (library.scconline.org)