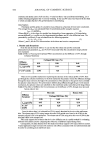
METHOD TO STUDY SKIN MOISTURIZERS 265 used was well cleaned with distilled water and cotton and dried with a paper towel 30 minutes before the readings. The room temperature (21 ø + IøC) and the relative humidity (50-60%) were held constant throughout the trial. The trial was performed over the winter months. At the start of the study, an initial value of capacitance was established after 30 minutes of acclimatization for the classification of the skin type regarding hydration characteristics (baseline values) (14). Five skin hydration readings at each test site were recorded and the mean values were used for the statistical analysis. The left forearm of each volunteer was treated with the formulations that were being studied. Five groups of eight women were used for the tests (a total of forty volunteers). Based upon the Tukey test, five volunteers for each group were sufficient to detect statistically significant differences. The first group used a formulation with no active substance (the base formulation for this study). The second group used the base formu- lation with 0.5 % retinol palmitate added (vitamin A test). The third group used the base formulation with 2% alpha tocopherol acetate added (vitamin E test). The fourth group used the base formulation with 0.1% ceramide III added (ceramide test). The last group used nothing on the skin (control). STATISTICAL ANALYSIS Data were analyzed statistically using an analysis of variance (ANOVA) parametric test, followed by the Tukey test, which was more appropriate for the mathematical model used in the experiment RESULTS AND DISCUSSION The volunteers had dry skin according to the values given by the manufacturer of the Corneometer ©. These subjects were chosen because some literature articles related that sufficiently moisturized skin did not undergo an enhancement in moisture when topical products were applied (16). Moreover, we followed the studies conducted by Hashimoto- Kumasaka eta/. (15), who showed that capacitance is a stable method to evaluate the hydration of dry skin. The results of cutis hydration for the formulations under study are shown in Table I. The results obtained from the study of the capacitance of the stratum corneum during the analysis of variance showed statistically significant differences among the studied periods of time and the studied formulations. The probability level for the tests to be statistically significant was at 5%. The water content in the stratum corneum after using the products of interest for seven days was higher than that found after 30 days of use. At the end of seven days, the capacitance value was higher in the stratum corneum, which indicated that the dry skin (dehydrated) retained hydration much better during the first week of the treatment. In order to observe which formulations presented statistically significant results, it was necessary to provide Tukey's test since more than two kinds of active substances were evaluated. Tukey's test showed that the control group (untreated) was the unique group that presented results statistically different from the others. The formulation with no

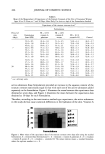
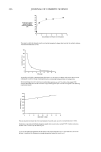
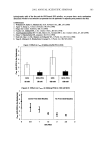
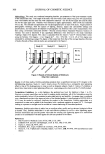
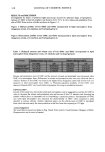
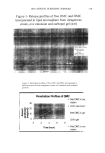
266 JOURNAL OF COSMETIC SCIENCE Table I. Mean of the Measurement of Capacitance of the Stratum Corneum of the Skin of Caucasian Women Ages 30 to 45 Years, at 7 and 30 Days, After Daily Use (twice a day) of the Formulation Studied Capacitance of the stratum corneum (a.u.) • Formulations Period of FB + 0.5% FB + 2.0% time Formulation vitamin A vitamin E FB + 0.1% (days) (base) (FB) palmitate acetate ceramide III Control 3O 59.4 + 0.5 41.6 + 1.8 51.4 + 4.5 54.0 + 3.3 46.2 + 2.7 43.8 + 1.8 63.8 + 2.3 56.2 + 4.3 70.0 + 2.8 32.6 + 2.9 45.8 + 2.2 50.4 + 2.3 55.4 + 2.1 62.2 + 3.7 36.8 + 1.1 62.6 + 4.4 75.2 + 2.3 70.0 + 2.9 48.6 + 1.5 43.8 + 0.8 56.2 + 1.3 49.4 ñ 3.6 55.2 + 1.6 46.6 + 1.7 42.4 + 3.3 45.2 + 2.6 57.0 + 1.9 61.6 + 2.6 66.2 _+ 1.9 36.2 + 2.3 50.2 + 2.3 56.4 + 4.8 48.8 + 4.3 58.0 + 2.3 36.8 + 1.3 54.2 + 1.8 49.4 + 3.1 50.4 + 1.8 62.4 + 3.9 42.4 + 1.5 52.8 + 3.3 33.8 + 1.1 38.8 + 1.3 53.6 + 1.8 36.6 + 1.5 37.2 + 1.5 48.6 _+ 1.9 50.0 + 1.7 55.2 + 3.1 40.2 + 2.5 44.8 + 1.6 39.0 x 2.1 61.4 + 2.1 52.6 + 1.1 41.6 + 2.7 60.4 + 4.4 52.4 + 2.5 51.0 + 2.0 57.0 + 3.9 42.6 + 1.3 44.2 + 3.6 51.4 + 3.0 37.8 + 1.6 45.0 + 3.5 32.6 + 1.1 42.6 + 1.1 54.0 + 1.2 50.6 + 2.9 54.4 + 1.l 26.8 + 0.8 43.4 + 1.7 43.4 + 3.8 48.2 + 1.6 55.8 + 2.9 34.8 + 1.5 50.4 + 1.5 42.0 _+ 0.7 45.2 + 1.3 53.0 + 4.6 38.6 + 1.1 t a.u.: arbitrary units. active substances (base formulation) provided an increase in the aqueous content of the stratum corneum statistically equal to that with each one of the active substances added separately to the formulation. Figure 1 illustrates the mean between the capacitance data obtained at seven days, and Figure 2 illustrates the mean between the capacitance data obtained at 30 days for each formulation. Therefore, according to the non-invasive method-type capacitance, the active substances in the study did not cause statistical differences in the hydration of the skin. Vitamin A .-. 80V• :5 6o •' 40 • 20 • 0 • T • T Formulations IE [] E+A : laE+E , alE+C ,, Ill Control Figure 1. Mean values of the capacitance data of the stratum corneum seven days after using the studied formulations. E = emulsion (base formulation) E + A = emulsion + vitamin A palmitate E + E = emulsion + vitamin E acetate E + C = emulsion + ceramide III. The values indicate means _+ standard deviation, where the replicate number is n = 8.
Purchased for the exclusive use of nofirst nolast (unknown)
From: SCC Media Library & Resource Center (library.scconline.org)