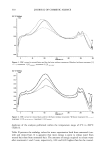
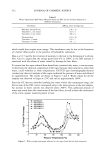
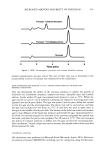
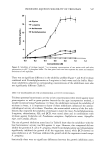
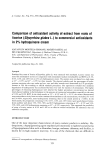
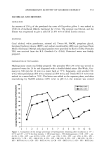
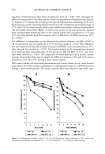
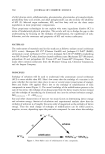
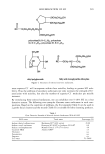
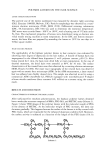
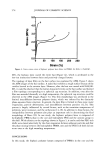
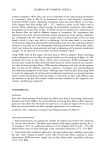
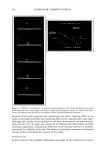
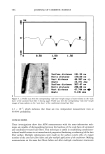
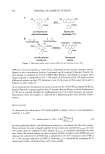
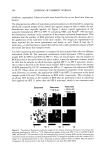
540 JOURNAL OF COSMETIC SCIENCE glucosamine, diethanolamine, triethanolamine, glycine, L-arginine, and methyl 4-hy- droxybenzoate sodium. Triclosan sufficient to ensure saturation was suspended in 10 ml of water or buffer containing increasing amounts of the solubilizers. Duplicate samples were rotated end to end in test tubes with screw caps at 30øC for 48 hours to reach equilibrium. The solubility was measured at 30øC because at this temperature it was easier to control temperature fluctuations during testing and sampling. Suspensions were passed through a 0.45-}•m filter (Osmonics, Minnetonka, MN), and the amount of triclosan dissolved in the filtered solutions was determined by HPLC. HIGH-PERFORMANCE LIQUID CHROMATOGRAPHY (HPLC) The HPLC method used in this study complied with specifications for precision, accu- racy, selectivity, linearity, and ruggedness as required by the USP XXIV (16). The following reagents and equipment were used: a Hewlett Packard ! 050 high-performance liquid chromotographer (Agilent Technologies, Palo Alto, CA), equipped with a vari- able wavelength UV detector, pump, injection device, and computerized data analysis system, and a Luna C•8 column (2 •m, 150 x 4.6 mm Phenomenex, Torrance, CA), controlled at +20øC. The mobile phase was a mixture of methanol:water (85:15) con- taining 0.1% H3PO 4. The flow rate was 1.0 ml/min -•, the injection volume was 10 }•1, and the UV detection was at 210 nm. A triclosan calibration curve was prepared from a series of diluted triclosan solutions that were prepared by dissolving 10 mg of triclosan, accurately weighed, in 100 ml of methanol with the aid of an ultrasonic bath. From this solution, several dilutions ranging from 10 }•g/ml -• to 250 }•g/ml -• were prepared. A calibration curve of the area under the curve (AUC) versus concentration was linear [y = 70875x + 94.649 (R 2 = 0.9998)] and was used to determine the concentration of triclosan in unknown solutions. Examples of chromatograms are shown in Figure 2. ANTIMICROBIOLOGICAL ACTIVITY Samples were sent to the SABS (South African Bureau of Standards, Pretoria, South Africa) where zone inhibition tests were performed on the samples (SABS method 730: Antibacterial Efficacy of Solid and Semi-Solid Antiseptics). Organisms tested against were Escherichia co/i, Pseudomonas aeruginosa, Staphy/ococcus aereus, Aspergillus niger, and Candida a/bicans. The following method was used: First, the triclosan powder was tested. Then the solubilizers in water and in buffer without triclosan were tested to determine the antimicrobial activity of each of the solubilizers alone. Afterwards, solutions con- taining the highest possible common concentration of triclosan that could be dissolved in all the solubilizer solutions were tested for antimicrobial activity. For example: A saturated solution of triclosan in an aqueous 1.0 M N-methylglucamine solution was prepared and the concentration of triclosan determined by HPLC. This was repeated for all the solubilizers at various concentrations. Based on these results, the highest common concentration that could be dissolved in each of the solubilizer solutions was determined. Solutions containing this concentration of triclosan, the equivalent amounts of the solubilizer in water, and the buffer at pH 7.4 were prepared and tested for antimicrobial activity. The antimicrobial activity of solutions containing only the solubilizers at the

INCREASED AQUEOUS SOLUBILITY OF TRICLOSAN 541 Triclosan + Sodium Benzoate Triclosan + N-methylglucamin _,• Triclosa• ! ! 2 4 6 Time (rain) Figure 2. HPLC chromatograms of triclosan and triclosan solubilizer mixtures. desired concentrations was also tested. The aim of these tests was to determine if the antimicrobial activity of triclosan was influenced by the solubilizers. ZONE INHIBITION TEST (SABS SM 730:1975): ANTIBACTERIAL EFFICACY OF SOLID AND SEMISOLID ANTISEPTICS This test determined the ability of the triclosan solutions to inhibit the growth of Escherichia co/i, Pseudomonas aeruginosa, Staphylococcus aereus, Aspergillus niger, and Candida albicans. Sterile molten TS agar was prepared and allowed to cool to 45øC. While the agar was left to cool, 0. ! ml of solutions containing the respective microorganisms were piperred into sterile petri dishes. The agar was poured into the petri dishes and swirled to mix the agar and the microorganisms. The plates were left to cool and set, and then the agar was incubated for two hours at 37øC. A cork bore was used to make holes in the agar in the middle of each petri dish. The bottom of the holes was sealed with molten agar to stop diffusion of the liquid test products underneath the agar. Approximately 0. ! ml of the test solution prepared as described in the previous paragraph was poured into the holes, and then the plates were incubated for 48 hours at 37øC. This test measures the ability of triclosan solutions to diffuse into the agar and kill the microorganisms. After incubation, Vernier caliper was used to measure the angular radius of the zone that formed around the hole. STATISTICAL ANALYSIS All calculations were performed in Microsoft Excel (Microsoft, Seattle, WA). Multivari- ate analysis of variance (MANOVA), including apost hoc comparison using the Newman-
Purchased for the exclusive use of nofirst nolast (unknown)
From: SCC Media Library & Resource Center (library.scconline.org)