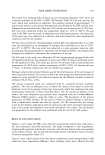
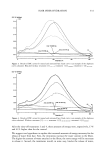
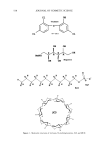
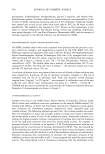
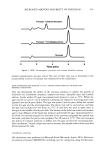
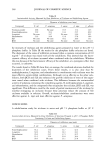
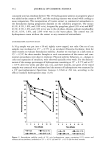
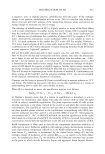
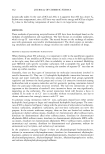
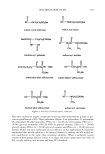
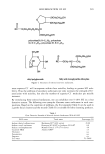
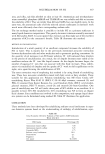
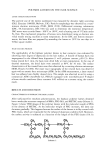
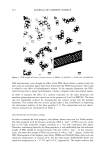
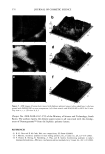
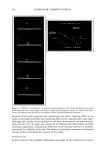
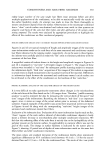
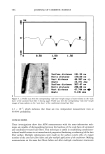
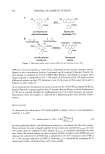
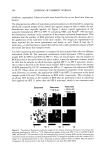
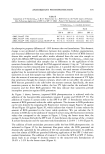
ANTIOXIDANT PHOTOPROTECTION 593 ESTERASE AND PHOSPHATASE ACTIVITY To facilitate penetration of the enzymatic activity dyes, the stratum corneum of each skin sample (-0.5 cm x 0.5 m) was removed by tape stripping (Scotch clear tape). These were the only samples in which the stratum corneum was removed. Without removal of the stratum comeurn, the enzymatic-activity dyes did not penetrate and enzymatic activity could not be detected. Each sample was incubated at room temperature in a 50-1aM calcein-am or fluorescein diphosphate solution (2:1 PBS:EtOH) for ten minutes. Cal- cein-am is nonfluorescent until active esterases act upon it to form fluorescent calcein (Figure lB, emission maximum 520 nm). Similarly, fluorescein diphosphate is nonflu- orescent until phosphatase activity leads to the formation of fluorescent fluorescein (emission maximum 514 nm). The samples were imaged on the two-photon microscope. Data from two control samples were also acquired on the two-photon microscope: the autofluorescence of the skin sample was collected and the fluorescence intensity of the calcein-am and FDP solutions used for incubation was also collected. The data were used for comparison with the images of skin incubated with dye to determine if enzymatic activity took place. RESULTS AND DISCUSSION Because their photoreactions may have a dramatic impact upon photoaging and photo- carcinogenesis, we focus upon ROS generation in the keratinocytes of the strata granu- losum, spinosum, and basale. Following irradiation by 1600 J m -2 UV of the ex vivo breast tissue tested, a dramatic increase in rhodamine-123 fluorescence, and thus ROS levels, was detected in all viable epidermal strata (Figure 2A-C) and in the collagen-rich dermis (Figure 2D). The images indicate the fluorescence intensity expected in the different strata following a UV dose of 1600 J m-2 they represent our controls for the two skin samples. As the images show, ROS are generated predominantly in the cytoplasm of the keratinocytes. This can be seen by noting the red and yellow areas surrounding the blue nuclei. The blue colors indicate the absence of detectable ROS. Because our ROS probe may not have penetrated the nuclear membrane, we cannot comment upon nuclear ROS generation at this time. These images are consistent with previous data (1) and result from the presence of UV-absorbing chromophores present in the cytoplasm of the cells (NADH/NADPH, 5 200 5 200 5 200 5 100 Figure 2. Two-photon fluorescence intensity images of R123 emission in viable ex vivo human breast skin following irradiation by 1600 J m 2 UV. These images represent the control data used to calculate the effect of the formulations tested upon ROS levels. The corresponding intensity scale bar is displayed below each image, where red represents the maximum number of ROS generated following irradiation. Blue indicates the absence of ROS. Images are displayed of the strata granulosum (A), spinosum (B), basale epidermis (C), and dermis (D). Each image is 50 t•m x 50 t•m.

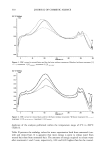
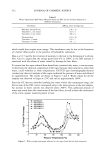
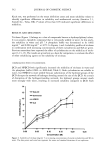
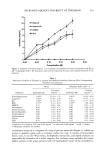
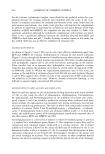
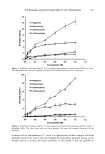
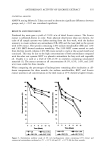
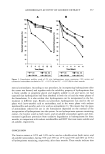
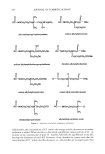
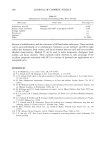
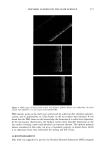
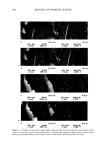
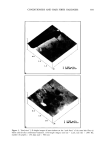
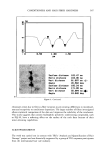
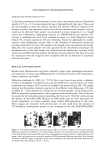
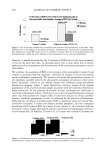
594 JOURNAL OF COSMETIC SCIENCE riboflavin, tryptophan). Identical results were found for the ex vivo facial skin (data not shown). The photoprotective effects of sunscreens and antioxidants are determined by comparing identically acquired images of the control data against images of skin to which the test formulations were topically applied. As Figure 3 shows, topical application of the sunscreen formulations SPF 8 or SPF 15 containing OMC and Parsol © 1789 decreases the fluorescence intensity in the cytoplasm of the stratum spinosum keratinocytes. This indicates that the number of ROS generated within the keratinocytes decreases due to the application of the sunscreen to the skin's surface. The images are representative of those acquired for the strata granulosum and basale as well. Table II lists the % reductionav,, in the fluorescence signal detected for each viable epidermal stratum of both the breast and facial skin samples tested. It is both interesting and important to compare the data acquired from the two different individuals (Table II). The sunscreen combination tested attenuates UVB by approxi- mately 80% for SPF 8 and 90% for SPF 15. Thus, we would expect that the amount of ROS detected in the layers below the skin's surface, where the sunscreen remains, would be 10% less for samples to which have been applied SPF 15 vs SPF 8 sunscreen. In fact, this is what is detected in the breast tissue studied. SPF 8 sunscreen reduces the amount of ROS generated by 84.7% increasing the SPF to 15 improves the reduction of ROS to 90.1%. These values are consistent with the absorptive properties of the sunscreens used. However, in contrast, the application of SPF 8 and SPF 15 sunscreens to the facial samples yields 42% and 79% reductions in ROS levels, respectively. This correlates to an almost 40% decrease in the number of ROS that are generated in skin to which has been applied the SPF 15 rather than the SPF 8 sunscreen, which is not consistent with Suns creen Suns creen Suns creen + Vit E-Ac + Vit E-AC + StayC 50 D 5 50 5 50 5 50 Figure 3. Two-photon fluorescence intensity images of the stratum spinosum of human ex vivo breast skin following irradiation by 1600 J m -2 UV. Displayed are images of skin with SPF 15 (A-C) and SPF 8 (D-F) OMC and Parsol © 1789 sunscreen (A,D), the sunscreen plus vitamin E acetate (B,E), and the sunscreen plus vitamin E acetate and sodium ascorbyl phosphate (STAY-C © 50) applied topically to the skin's surface (C,F). Image 3C is predominantly blue in color, indicating an almost complete absence of ROS. Note the absence of apparent cell structure due to the lack of fluorescence and thus detectable ROS.
Purchased for the exclusive use of nofirst nolast (unknown)
From: SCC Media Library & Resource Center (library.scconline.org)