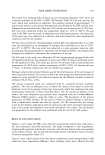
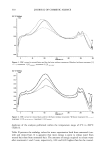
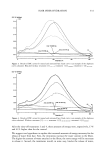
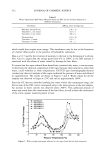
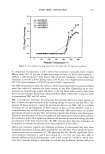
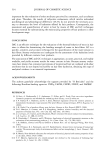
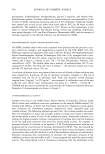
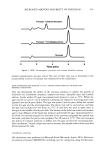
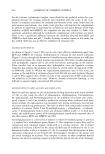
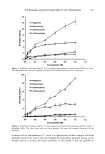
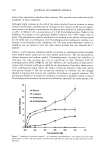
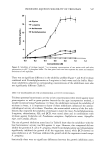
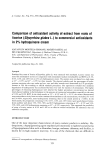
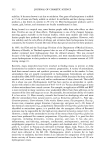
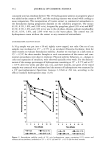
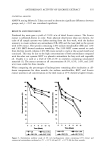
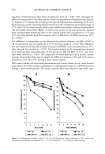
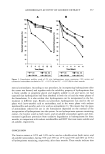
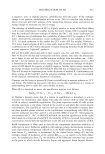
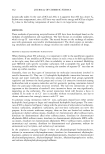
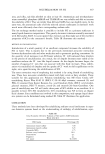
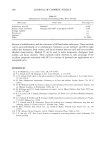
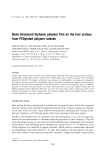
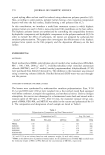
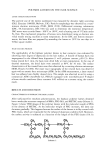
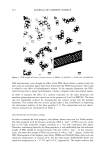
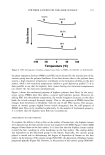
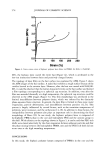
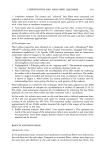
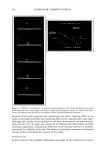
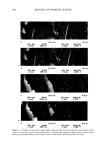
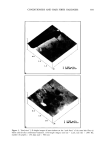
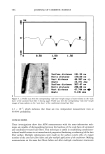
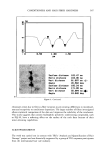
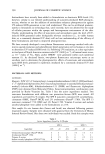
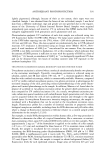
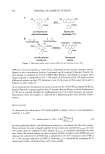
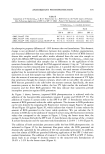
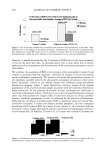
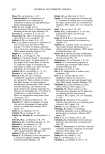
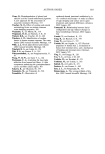
HAIR FIBER HYDRATION 529 The tresses were maintained for 36 hours in an environment adjusted to 20ø-22øC and a relative humidity of 50-60%. A DSC 204 Netzsch TASC 414/3A was used for the tests, which were performed in duplicate. The samples consisted of approximately 7.5 mg of entire tresses cut into pieces, homogenized, and divided for the DSC and GC tests. Compressed air was used with a flow rate of 10 ml/min and a heating rate of 20øC/min. The tests were conducted within the temperature range of -10øC to 300øC. The pan used in the DSC tests was made of aluminum and sealed under pressure. An empty pan of the same type was employed as a reference and tested under the same experimental conditions used for the samples. The hair mass used for the chromatographic analysis (GC) was approximately 0.1 g. The oven was maintained in an atmosphere of nitrogen (82) and heated at a rate of 2.0øC/ min (25 ø to 300øC). The oven outlet was connected to a semi-automatic injection valve for sampling the gas generated by evaporation and thermal breakdown the samples were subsequently analyzed to determine the composition of the gas. The GC used in this study was a Shimadzu GC-8A chromatograph equipped both with a Porapak-Q column for the separation of water and a PM-5A column (molecular sieves) for the separation of CO 2. The carrier gas was He (35 ml/min), with an injector/detector temperature of 140øC and a column temperature of 100ø-130øC the heating rate was 5øC/min. A thermal conductivity detector (TCD) was employed. Nitrogen served as the internal reference gas for the determination of the percentages of water and carbon dioxide. The correction factor for each sample was determined from the analytical curves provided by the detector response for the different volumes of injected substance (820 , CO2, or 82). The sensory evaluation panel was conducted with 41 consumers of hair treatment products. This was an ordination test in which the subjects were asked to assess the hydration levels of two groups of three hair tresses each, which had undergone the same moisturizing treatments as those described above. For the statistical analysis of the results, the score frequencies per product were compared with the Cochran-Mantel- Haenszel (CMH) statistics, using the orders as scores. The description of the general application of CMH statistics for the cases in which an ordinal response is associated with a classificatory variable was cited by Agresti (16). We assumed that the average scores for the reference population were the same across the entire assortment of products used in this study this hypothesis was tested and proved to be sound. The calculations and preparation of the database were performed with the aid of the SAS system. RESULTS AND DISCUSSION Figures 1 and 2 show the DSC curves both for untreated hair and for hair subjected to the four treatments described previously. The peaks correspond to hair degradation. Upward peaks represent endothermic reactions, with the first lowest peak corresponding to the release of water. The second and third peaks denote endothermic fusion reactions of keratin polypeptide chains (11). Figures 3 and 4 show details of the first lowest endothermic peak corresponding to AH values for water vaporization (AHvap). These enthalpy values were collected for each

530 JOURNAL OF COSMETIC SCIENCE DSC '10 • • •XO 0.10 /// -. -.... •. 4 .•' o.• ...... •',., i "- ,'1 I i -o .os T•r•um Figure 1. DSC cu•es for treated hairs and for the hairs without treatment. Bleached without treatment [1] ...... treatment 1 [2] __ treatment 2 [3] Figure 2. DSC curves for treated hairs and for the hairs without treatment. Without treatment Ill ...... treatment 3 [2] ß treatment 4 [3] • duplicate of the analyses performed within the temperature range of 0øC to 200øC (Table I). Table II presents the enthalpy values for water vaporization both from untreated (con- trol) and treated hair. It is apparent that more energy is spent to release water from treated hair than from untreated hair. The amounts of energy required to release water after treatments 1 and 2 were, respectively, 44% and 83% higher than for the control.
Purchased for the exclusive use of nofirst nolast (unknown)
From: SCC Media Library & Resource Center (library.scconline.org)