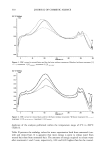
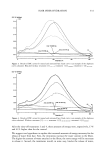
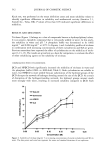
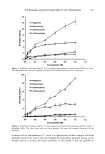
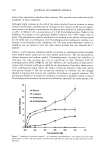
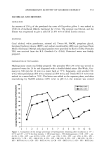
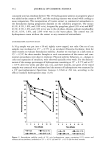
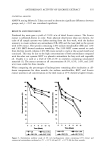
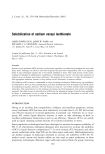
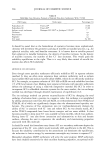
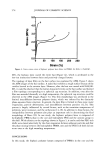
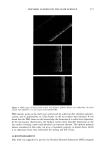
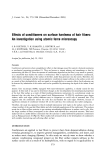
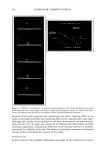
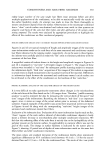
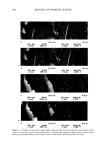
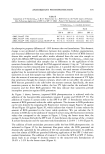
ANTIOXIDANT PHOTOPROTECTION 595 Table II Comparison of % Reductiona•g in R123 Fluorescence (i.e., ROS level) in the Viable Layers of Human Skin Following Application of SPF 8 or SPF 15 OMC +Parsol 1789 Sunscreen and Antioxidants % Reduction•vg (+ standard deviation) Breast Facial SPF 8 SPF 15 SPF 8 SPF 15 +OMC, Parsol © 1789 +OMC, Parsol © 1789, vitamin E acetate +OMC, Parsol © 1789, vitamin E acetate, STAY-C © 50 84.7 (1.1) 90.1(1.1) 42.2 (4.2) 79.4 (2.0) 88.3 (0.8) 91.9 (0.9) 41.8 (6.5) 79.0 (4.2) 91.7 (1.1) 95.5 (0.5) 54.0 (2.4) 84.1 (3.7) the absorptive property difference of-10% between the two formulations. This dramatic change is not attributed to differences between skin samples. Cellular, pigmentation, and structural differences that may contribute to variability in the level of ROS detected between skin samples would not affect results obtained from the same skin sample to which the different SPF formulations have been applied. The % reduction•vg values may differ between individual skin samples due to differences in the application of the sunscreen formulations. Although the FDA-approved amount (2 mg cm -2) of sunscreen formulation was first measured prior to application, it is possible that less adhered to the facial skin as opposed to the breast skin. As a result, the total amount of formulation applied may be inconsistent between individual samples. Thus, UV attenuation by the sunscreens on each skin sample may differ. The data are consistent with the conclusion that the amount of sunscreen present upon the skin determines the amount of UV light that penetrates through the stratum corneum, which will in turn affect the amount of ROS that are generated in the cells below the stratum corneum. Specifically, the more sunscreen present at the skin's surface, the less UV light reaches the nucleated kera- tinocytes and the fewer ROS generated. The data indicate that sunscreens provide incomplete protection against ROS generation. As Figure 3 shows, however, improved ROS photoprotection is achieved with the addition of the bioconvertible antioxidants vitamin E acetate and STAY-C © 50. The addition of vitamin E acetate either to the SPF 8 or SPF 15 formulation reduces the amount of ROS generated within the viable epidermis. The decrease in ROS production can be seen directly by comparing the fluorescence intensity images Figures 3A against 3B and Figure 3D against Figure 3E, which indicate that vitamin E acetate reduces the amount of ROS generated in the lower viable epidermis. We can calculate the % decrease in ROS due to the addition of vitamin E acetate using the fluorescence intensity values that correspond to the images in Figure 3. Using the breast tissue data, the average % decrease (for both the SPF 8 and 15 data) between the average of the +vitamin E acetate formulation and the sunscreen-only formulations is 20.9% + 3.9% (Figure 4). The addition of both antioxidant precursors yields the best ROS photoprotection. As indicated in Figure 3C by the dominant blue-green colors, the ROS generated are dramatically quenched by the addition of the two antioxidant precursors. In addition, note that almost all ROS are quenched following application of the SPF 15-dual anti- oxidant formulation. The addition of vitamin C to either the SPF 8 or SPF 15 formu- lation leads to an average % decrease relative to the sunscreen-only formulations of 50.4% + 5.2% for the breast tissue (Figure 4).

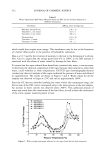
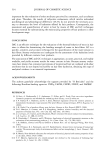
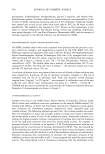
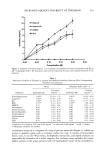
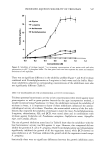
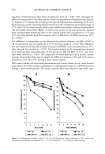
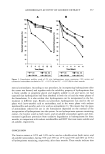
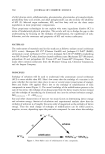
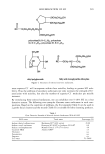
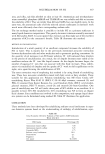
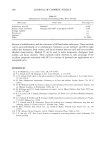
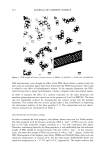
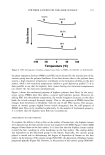
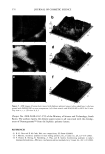
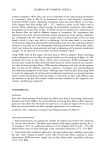
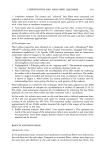
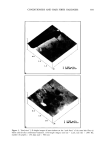
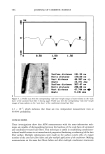
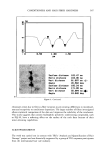
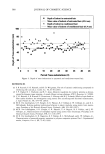
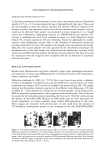
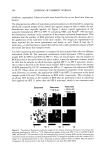
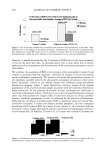
596 JOURNAL OF COSMETIC SCIENCE %-Decrease in ROS Levels of the Lower Epidermis Due to eo ...... _B_ •i • c_o_n_v_ _e_rtib_l•. _An_. _t_i_o_,_ __da•_ ___s_: - A_ y_e_ _r_ag_e_ 9__f_SP_F. •$_ &_ _1_$_ __•__t__a_ 50.4% + 5.2% / [] Breast • :::::::::::::] 21.5'/, + 2.1 Y, o Vitamin E Acetate Vitamin E Acetate, $TAY-C 50 Figure 4. The % decrease in ROS levels, compared to the sunscreen-only formulations, in the lower, viable epidermis due to the addition of antioxidant precursors. All fluorescence intensity data acquired for both skin samples and at both SPF values are used to calculate % decrease. Each bar in the graph represents the average decrease in ROS due to the addition of the antioxidant(s) to the sunscreen formulations. However, it should be noted that the % decrease in ROS levels in the lower epidermis is less for the facial skin data. As discussed above, this is most likely due to uneven application of the formulation and bioconversion of the antioxidant precursors to active antioxidants. We attribute the quenching of ROS to the presence of the antioxidants vitamin E and vitamin C generated from the enzymatic conversion of vitamin E acetate and sodium ascorbyl phosphate, respectively. The presence of esterase and phosphatase enzymes in the epidermis naturally converts the photostable antioxidant precursors to their active forms. Enzymatic activity in the studied samples was confirmed using two-photon fluorescence imaging. Figure 5 shows fluorescence intensity images of the stratum granulosum of the ex vivo facial skin sample incubated with the enzymatic fluorescence probe calcein-am. In the presence of esterase activity, nonfluorescent calcein-am is converted to fluorescent calcein, which gives rise to the increased fluorescence intensity above that detected from the images either of calcein-am solution or of skin autofluo- rescence. Similarly, phosphatase activity is confirmed by the presence of fluorescence following the conversion of nonfluorescent FDP to fluorescein (data not shown). Bio- conversion of vitamin E acetate and sodium ascorbyl phosphate, and the consequent quenching of UV-induced ROS by vitamin E and vitamin C, are consistent with the enzymatic activity images showing the presence of esterase and phosphatase activity in ex vivo human skin. In addition, Trivedi et al. (17) report that vitamin E decreases the Calcein-AM -Calcein-AM +Calcein-AM A C 5 1000 5 1000 5 1000 Figure 5. Fluorescence intensity images of (A) the esterase activity probe calcein-am in solution, (B) skin autofluorescence, and (C) the stratum granulosum of calcein-am-incubated ex vivo facial skin.
Purchased for the exclusive use of nofirst nolast (unknown)
From: SCC Media Library & Resource Center (library.scconline.org)