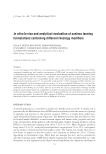
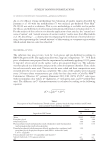
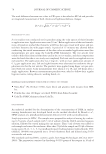
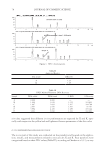
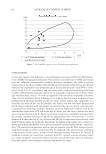
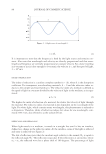
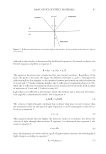
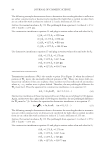
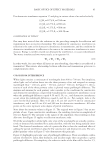
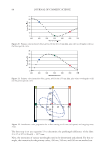
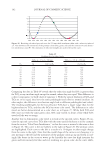
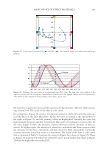
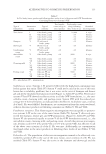
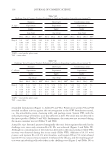
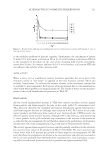
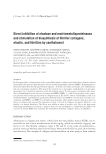
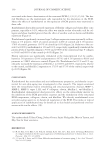
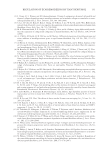
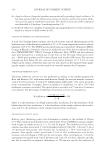
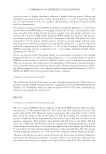
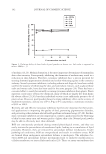
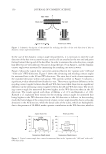
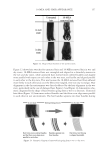
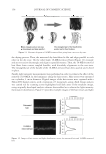
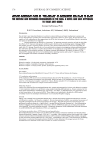
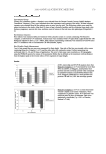
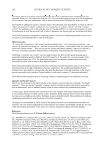
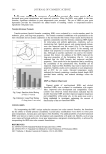
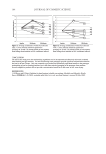
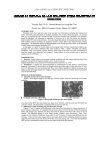
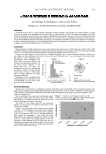
BASIC OPTICS OF EFFECT MATERIALS 95 Use destructive interference equation 17 and plug in various values of m and solve for λ1: ( ) ( ) ( ) 1 2 1 1 1 2 1 1 1 2 1 1 1275 2550 1 1275 850 2 1275 λ λ λ λ λ λ = = = = = = nm nm 5 510 3 1275 364 1 2 1 1 nm nm ( ) .29 λ λ = = CONSERVATION OF ENERGY One may have noticed that the solutions to the preceding examples for refl ection and transmission have an inverse relationship. The condition for constructive interference in refl ection is the same as for destructive interference in transmission, and the condition for destructive interference in refl ection is the same as for constructive interference in trans- mission. Energy is neither created nor destroyed by interference, it is just redistributed. Two waves interfere and two waves result, as in equation 18: W W W W I I R T 1 2 + = + (18) In other words, for cases where all layers are non-absorbing, then what is not refl ected is transmitted. This inverse relationship between refl ection and transmission gives rise to complementary colors. COLOR FROM INTERFERENCE White light contains a continuum of wavelengths from 400 to 700 nm. For simplicity, white light can be broken down into the three primary colors and assigned an average wavelength: blue = 450 nm, green = 550 nm, and red = 650 nm. In Figure 15, the in- tensity of each of the three primary colors is plotted versus pathlength difference. The maxima and minima for each primary color correlate to the conditions for constructive and destructive interference, respectively. Conditions for constructive interference occur when the pathlength difference equals 0.5λ and 1.5λ, etc., and destructive interference occurs when the pathlength difference equals λ and 2λ, etc. For example, look at the curve for the blue primary. Here, 0.5λ and 1.5λ are 225 and 675 nm for constructive interference, and λ and 2λ are 450 and 900 nm for destructive interference. All other points on the curve represent some degree of partial interference. Note about the intensity values in Figure 15: The original wave in Figure 3 has an am- plitude of one. Upon constructive interference, the resulting wave has an amplitude of two (see Figure 8). The intensity is the square of the amplitude, thus resulting in four. Also note that Figure 15 applies to refl ection interference only. Of all the wavelengths in white light, only a few of the wavelengths are actually construc- tively or destructively interfered for a particular fi lm, with the rest being partially inter- fered. The observed interference color of a particular fi lm is then the combined effect of adding the partial interferences plus the few constructive and destructive ones. The sim- plifi ed primary colors in Figure 15 also demonstrate this principle. Figure 16 highlights particular cases of pathlength differences. There are infi nite combi- nations of refractive index, fi lm thickness, and incident angle that can produce a given pathlength difference. For simplicity, the refractive index of the fi lm will be fi xed at 2.5,

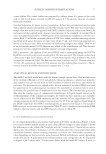
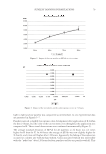
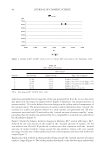
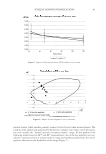
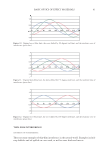
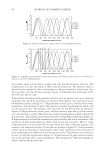
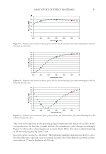
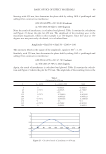
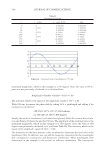
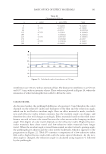
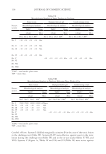
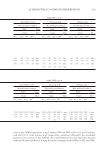
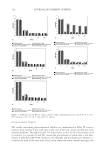
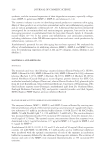
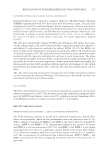
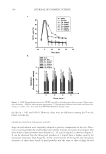
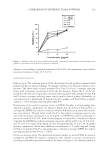
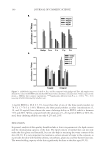
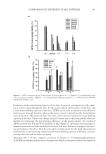
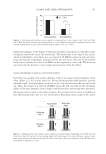
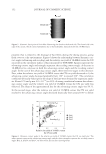
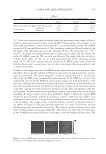
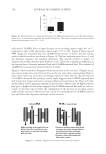
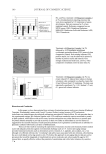
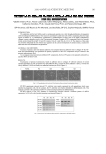
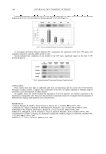
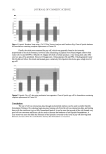
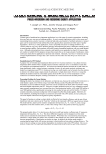
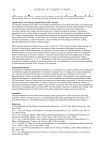
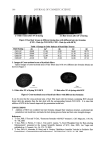
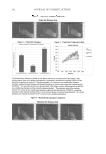
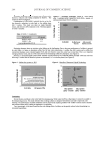
JOURNAL OF COSMETIC SCIENCE 96 the incident angle will be held at normal, and only the fi lm thickness will vary. This simplifi cation is in fact the reality of effect material production. The refractive index is dictated by the material of choice and samples are always measured at a fi xed angle. As a fi lm is grown, only the thickness changes. Figure 16 highlights fi lm thicknesses of 60, 80, 100, 120, and 155 nm. If the relative intensities of the primary colors for each are plotted, one can see how the resulting color caused by interference is obtained. The primary color intensities for the 60-nm fi lm are plotted in Figure 17. High intensities of red, green, and blue add to white interference, also referred to as pearl. The intensities of other wavelengths are added to fi ll out the spectral curve. The primary color intensities for the 80-nm fi lm are plotted in Figure 18. High intensities of red, green, and low-intensity blue add to yellow interfer- ence, also referred to as gold. The intensities of other wavelengths are added to fi ll out the spectral curve. The primary color intensities for the 100-nm fi lm are plotted in Figure 19. A high intensity of red and low intensities of green and blue add to red interference. The intensities of other wavelengths are added to fi ll out the spectral curve. There is a blue component observed of less than 450 nm that makes this color technically magenta. The primary color intensities for the 120-nm fi lm are plotted in Figure 20. A high intensity of blue and low intensities of red and green add to blue interference. The intensities of other wavelengths are added to fi ll out the spectral curve. The primary color intensities for the 155-nm fi lm are plotted in Figure 21. A high intensity of green and low intensi- ties of red and blue add to green interference. The intensities of other wavelengths are added to fi ll out the spectral curve. Figure 15. Intensity of the three primary colors versus pathlength difference. Figure 16. Highlighted pathlengths for selected fi lm physical thicknesses. The thickness of each fi lm is in- dicated on top of the highlighted line.
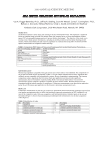
Purchased for the exclusive use of nofirst nolast (unknown)
From: SCC Media Library & Resource Center (library.scconline.org)