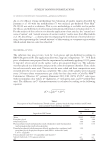
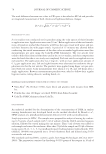
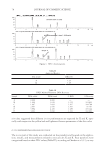
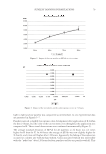
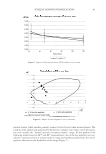
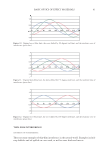
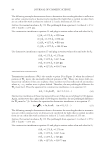
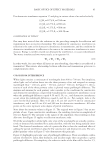
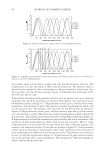
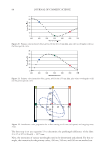
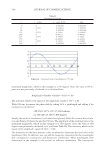
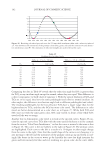
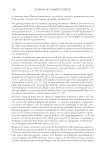
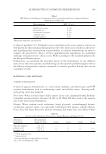
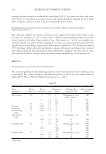
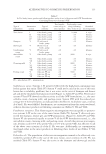
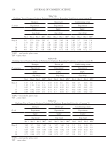
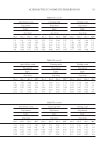
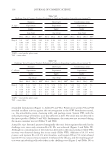
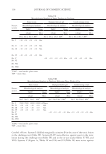
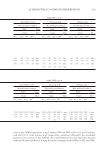
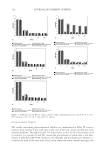
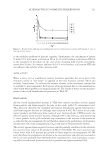
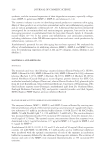
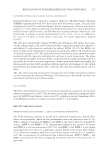
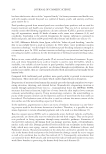
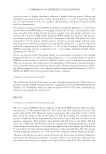
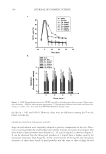
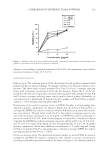
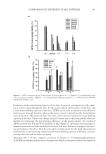
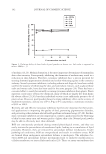
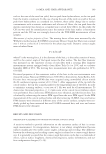
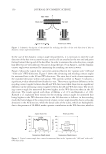
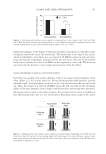
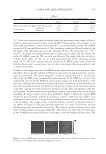
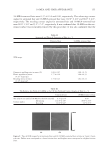
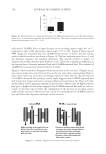
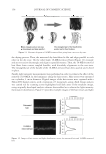
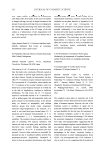
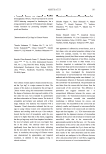
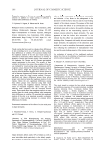
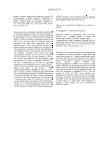
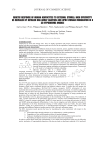
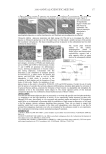
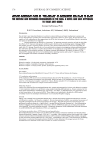
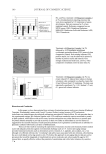
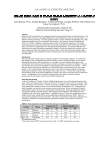
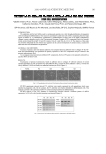
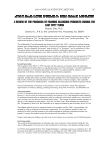
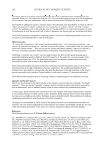
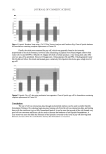
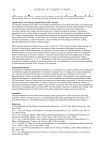
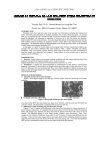
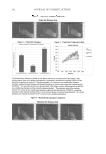
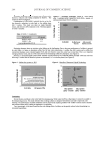
SUNLESS TANNING FORMULATIONS 79 light to light and one panelist was categorized as intermediate. In vivo experimental data are presented in Figures 5–7. Panelists noticed a slightly less intense color development after application of X within the fi rst 24 hours, but the color of the tan was more even throughout the application area compared to K. These visual observations were confi rmed instrumentally (Figure 5). The average standard deviation of ΔE*ab for all panelists at 24 hours was 4.2 times higher for K than for X. At 48 hours the average of ΔE*ab was now slightly higher for X than K, and it was still higher after 120 hours. Apparently the fading of the sunless tan occurred at a slower rate with X than with K. Color associated with X was still visible with the “naked eye” after 120 hours for four panelists and for one panelist with K. This Figure 3. Impact of the test articles on the color response in vitro at 72 hours. Figure 2. Impact of the test articles on ΔE*ab in vitro vs time.

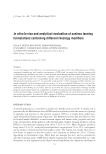
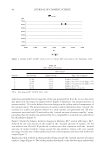
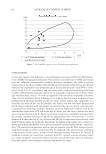
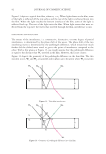
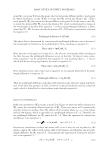
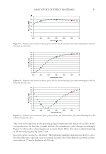
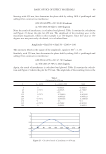
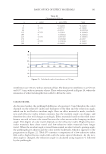
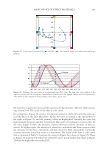
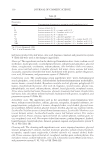
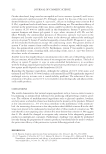
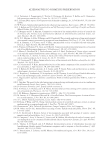
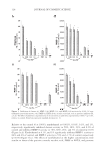
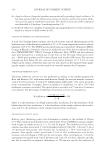
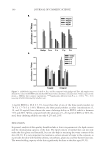
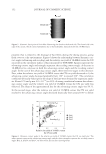
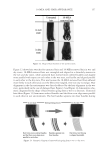
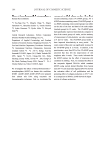
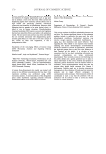
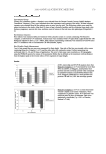
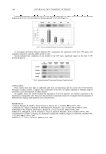
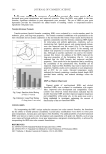
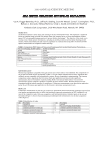
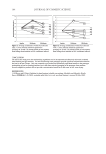
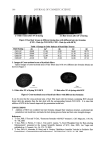
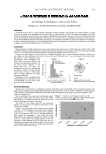
JOURNAL OF COSMETIC SCIENCE 80 indicates potentially better longevity of the tan generated by X vs K. In vivo data were also plotted in the respective fi gures below. Figure 6 illustrates “the natural universe of suntan tonality” (9) via the balance between changes in the yellow and red components of the natural suntan. The natural universe of suntan tonality determines how “natural” the tonality of a sunless tan appears relative to a truly natural, sun-generated tan. All mea- surements associated with X were within the “natural universe of suntan tonality” range, providing that the sunless tan generated by X is comparable to a natural sun-induced tan for all panelists (Figure 6). Figure 7 shows the balance between changes in Chroma, ΔC*, and in refl ectance, ΔL*, induced by the test articles in the realm of the “natural universe of suntan” (9) for sun-induced tan. Overall, X produced a sunless tan color consistent with the “natural universe of suntan tonality” range, except for one panelist, whose color was outside the range, but the rest of the panelists had close color responses and were well within the range (Figure 7). Application of K resulted in three panelists being outside the “natural universe of suntan tonality” range (Figure 6). Two of the panelists developed a color that was more yellow than Figure 4. Changes in ΔC* and ΔL* values in vitro at 72 hours. ΔL* values indicate the “darkening” trend. Table IV ITA° Values of Panelists ITA° values* Panelist Left forearm Right forearm Skin color categories 1 52.86 51.71 Light (41 to 55) 2 52.48 55.74 Light (41 to 55) to very light (55) 3 50.47 55.12 Light (41 to 55) to very light (55) 4 53.01 51.75 Light (41 to 55) 5 39.78 40.55 Intermediate (28 to 41) *ITA = [Arc tangent ((L*-50)/b*)] 180/3.1416.
Purchased for the exclusive use of nofirst nolast (unknown)
From: SCC Media Library & Resource Center (library.scconline.org)