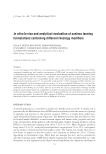
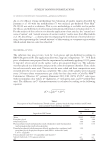
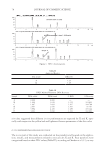
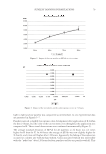
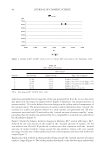
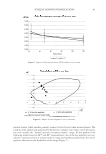
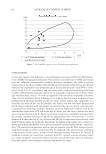
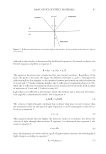
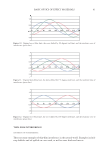
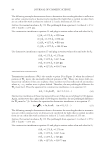
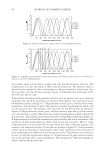
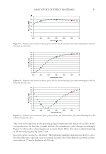
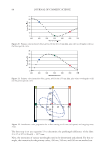
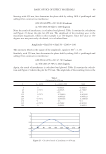
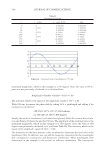
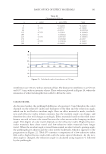
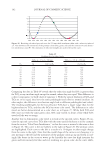
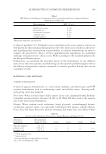
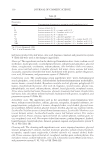
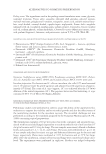
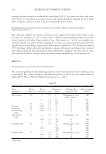
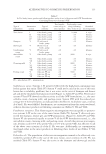
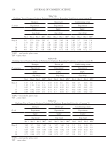
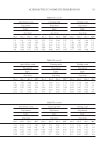
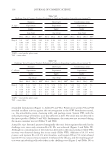
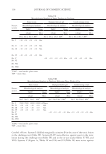
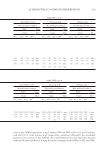
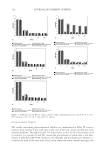
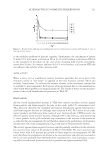
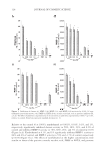
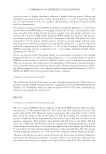
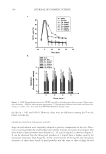
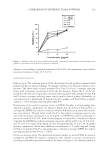
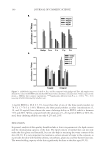
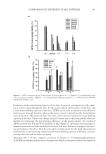
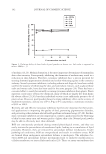
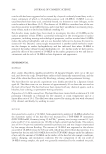
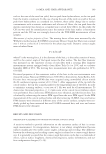
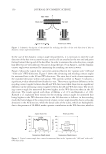
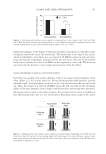
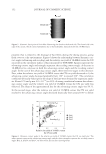
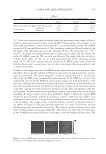
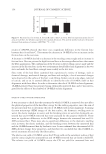
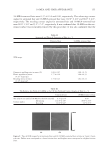
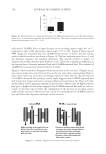
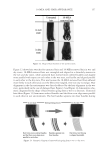
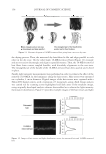
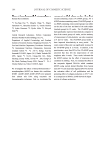
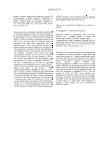
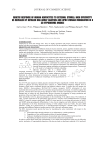
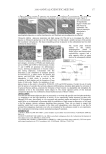
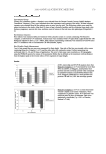
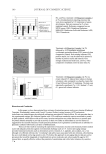
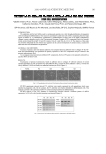
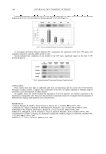
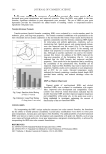
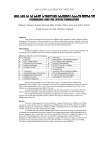
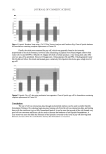
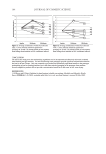
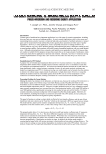
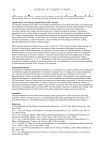
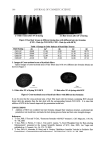
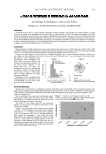
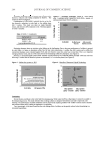
BASIC OPTICS OF EFFECT MATERIALS 97 The color series depicted in the preceding fi gures represents the nature of an effect mate- rial production. As the fi lm is made thicker, the interference color changes accordingly. Figure 22 shows this color progression in more detail. Here, the color is plotted starting at 60 nm and progressing every 5 nm. Spectral curves can also be calculated. The following example demonstrates how to calcu- late the refl ectance spectral curve at normal incidence for a thin fi lm (in air) with a refrac- tive index of 2.5 and a thickness of 255 nm. Figure 17. Primary color intensities (blue, green, red) for the 60-nm fi lm, plus other wavelengths to fi ll out the pearl spectral curve. Figure 18. Primary color intensities (blue, green, red) for the 80-nm fi lm, plus other wavelengths to fi ll out the gold spectral curve. Figure 19. Primary color intensities (blue, green, red) for the 100-nm fi lm, plus other wavelengths to fi ll out the red spectral curve.

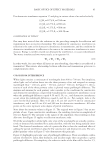
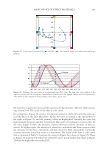
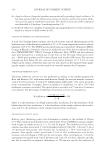
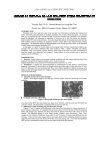
JOURNAL OF COSMETIC SCIENCE 98 The fi rst step is to use equation 13 to determine the pathlength difference of the fi lm: 2 × 2.5 × 255 × Cos(0) = 1275 nm. Next, the intensities of various wavelengths need to be determined and plotted. For this ex- ample, the intensities for the primary colors, 450 nm, 550 nm, and 650 nm are worked out. Figure 21. Primary color intensities (blue, green, red) for the 155-nm fi lm, plus other wavelengths to fi ll out the green spectral curve. Figure 22. Interference color progression for a fi lm starting at 60 nm (red square) and stepping every 5 nm. Figure 20. Primary color intensities (blue, green, red) for the 120-nm fi lm, plus other wavelengths to fi ll out the blue spectral curve.
Purchased for the exclusive use of nofirst nolast (unknown)
From: SCC Media Library & Resource Center (library.scconline.org)