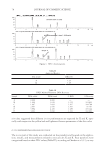
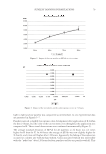
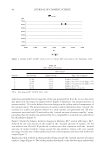
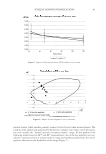
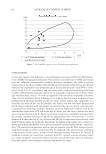
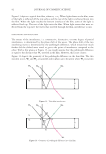
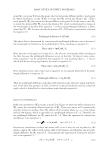
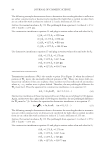
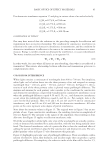
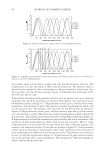
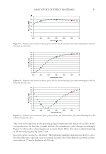
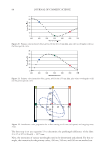
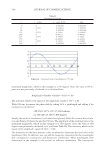
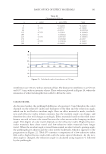
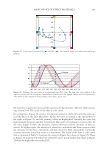
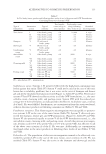
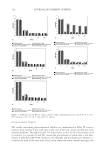
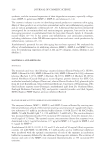
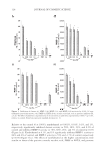
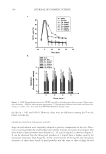
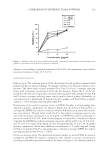
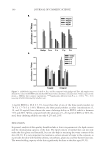
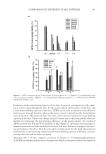
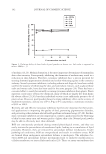
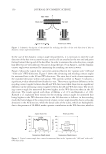
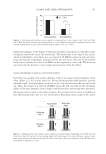
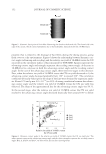
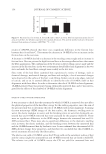
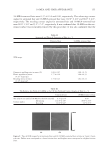
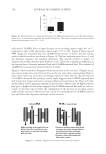
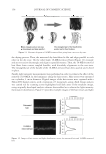
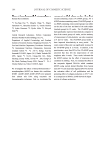
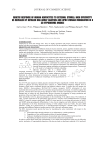
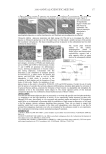
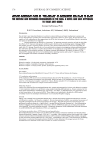
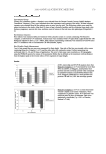
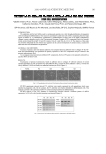
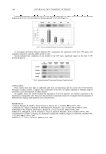
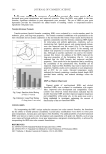
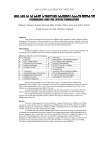
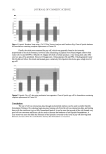
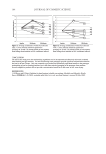
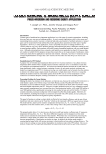
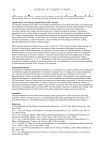
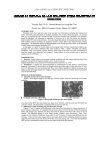
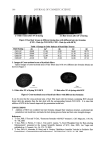
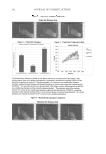
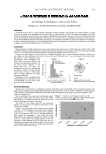
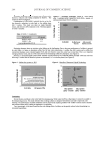
SUNLESS TANNING FORMULATIONS 77 citrate buffer. The citrate buffer was prepared by adding about 0.9 grams of the citric acid to 100 ml of water, titrated to pH 4.0 using a 0.1 N aqueous solution of sodium hydroxide (NaOH). Standard preparation for known in-house formulations. A base was provided and used to spike with a known amount of standard, used for the standard curve. The base was treated like a sample that was stirred and agitated with NaCl-saturated aqueous solution and water for six hours and then spiked with a known concentration of the standard. A standard linear curve was prepared as follows: 0.0895 grams of the standard was weighed in a 50-ml volu- metric fl ask, 10 ml of the saturated solution of NaCl was added, and the remaining volume was fi lled with water. Amounts of 2 μl, 5 μl, 10 μl, 15 μl, and 20 μl were pipetted into 20-ml scintillation vials. Fifty microliters of derivatizing reagent was added. Then 10 ml of an acetonitrile:water (50:50) solution was added to the scintillation vial. The derivati- zation reaction was completed after fi ve minutes at room temperature. HPLC parameters. An Agilent 1100 series HPLC with a quaternary pump and UV/Vis DAD detector with a detection wavelength at 262 nm was used. The column utilized was a Discovery 5-μm C18 column, 25 cm × 4 mm, from Supelco (Cat.# 504971-40), with an injection volume of 35 μl. The fl ow rate was set a 1 ml/min at 45°C. The run time was 25 min. An acetonitrile: water (50:50) solution was the mobile phase (isocratic). The re- tention time for the DHA-derivatized complex was 5.3 min. ANALYTICAL RESULTS AND DISCUSSION This HPLC method works well with the known sample matrix base. Our modifi cations of the method of Biondi et al. (10) included the following changes: a matrix base (placebo) and samples were pre-mixed with an NaCl saturated solution and water, and stirred for six hours. The base matrix was spiked with a known amount of standard (DHA) and used for quantitation. It is advantageous to prepare the standards in a known matrix since it eliminates the possibilities of interference from that matrix. This method also gives reli- able data for similar types of commercial formulations. A liquid–liquid extraction by dichloromethane of the commercial samples, for which the base matrix is not available, can be effective for free DHA extraction and the removal of base ingredients (10). The column temperature for the analyses was increased to 45°C for an improved peak shape of the DHA component. The HPLC chromatograms are presented in Figure 1, the results of DHA analysis in test articles are depicted in Table II, and a correlation between the DHA added to the base matrix and the DHA found is shown in Table III. IN VITRO EXPERIMENTAL DATA AND DISCUSSION In vitro experimental data are presented in Figures 2-4 below. As shown in Figure 2, both test articles showed similar trends in total color (ΔE*ab) changes vs time. Figure 3 shows the differences in the yellow (Δb*) and the red (Δa*) values after 72 hours of test article application. According to Jermann et al. (6), this particular time interval provides good correlation between relative tanning responses in vitro/in vivo. Noticeable variations in color depending on the test article were observed. Yellow/red balances varied, depending on the test article: X generated more red/same yellow color compared to K. As illustrated in Figure 4, ΔL* values after 72 hours were darker with the same ΔC* values X vs K. In

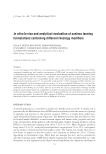
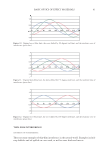
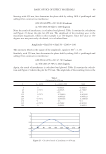
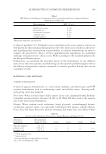
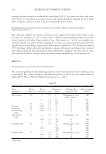
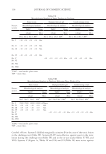
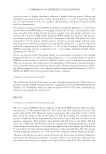
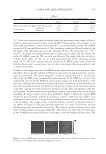
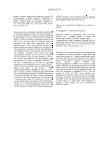
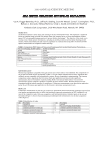
JOURNAL OF COSMETIC SCIENCE 78 Table III HPLC Method Validation: DHA Recovery Sample DHA added DHA found % RSD % Recovery A 0.000 0.000 — — B 1.000 1.049 3.376 104.892 C 1.997 2.093 3.307 104.788 D 2.997 2.930 1.597 97.767 E 3.994 4.120 2.189 103.144 F 4.993 5.096 1.443 102.062 Figure 1. HPLC chromatograms. Table II Analytical Results Test article DHA (%) X 3.25 K 3.18 vitro data suggested that different in vivo performances are expected for X and K, espe- cially with respect to the yellow/red and lightness/chroma parameters of the skin color. IN VIVO EXPERIMENTAL DATA AND DISCUSSION The in vivo part of this study was conducted on fi ve panelists and focused on the applica- tion, results, and measurements related to test articles X and K. Four panelists were categorized based on their ITA° values (Table IV), according to Chardon et al. (11), as very
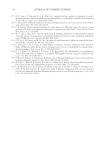
Purchased for the exclusive use of nofirst nolast (unknown)
From: SCC Media Library & Resource Center (library.scconline.org)