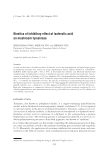
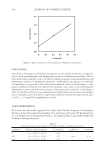
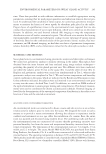
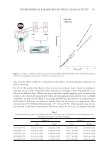
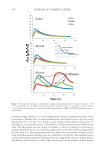
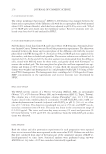
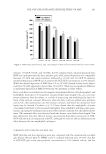
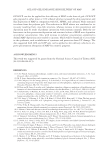
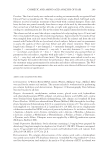
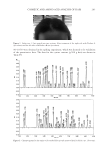
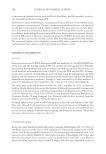
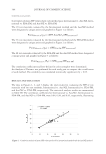
ENVIRONMENTAL PARAMETERS ON SWEAT GLAND ACTIVITY 249 E′, E″, and tan δ at each time point in the experiment. The deviation in viscoelasticity between trials refl ects the inherent randomness in the logistics of crosslinking a slow- moving, highly viscous prepolymer—including slight variations in the volume of each catalyst droplet, mixing effi ciency, and sample loading time. Although the resin consis- tency varies slightly with time from trial to trial, the mean time of E′/E″ inversion is approximately 5 min (±12 s). Hence, 5 min was chosen as the length of curing for acquir- ing in vivo impressions. In reality, however, the replicas were not removed for another 2–3 min (i.e., total cure t = 7–8 min) due to post-testing interviews. From the rheology data (Figure 1), the advantage of waiting an additional 2–3 minutes ensures a rubbery consis- tency and that E′ E″ (16). In general, excess curing time ( 5 min) does not infl uence the quality of the replica and ultimately produces a stronger, more uniform, and cohesive impression that is easily peeled from the substrate. QUANTIFICATION OF PERSPIRATION WITH SKIN REPLICAS After 30 min equilibration in the environmental room, subjects were placed in the sauna (usually at 45°C and 35% RH) and allowed to acclimatize for 10 min followed by a 20 min perspiration period (Test 1). At the beginning of the perspiration period, absorbent pads were placed in the axillae—they were later weighed at the end of the test. After a total of 30 min in the chamber, replicas were obtained on the volar fore- arm, using a four-quadrant sampling area immediately adjacent to the antecubital fossa (inner elbow). The replicas were allowed to set for 5 min, then removed. Quantifi cation of the number of active eccrine pores was achieved using the image analysis software, ImageJ. Figure 1. Average dynamic time sweep profi le for curing of replicas as a function of time. The average gel point for the formulation, where E′ = E″, occurs at 297 ± 12s (n = 5 1 Hz 25.7°C).

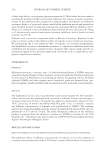
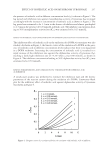
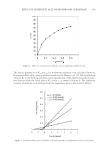
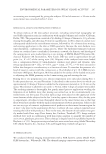
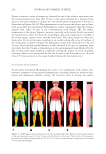
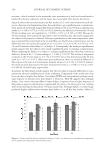
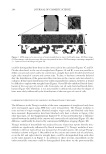
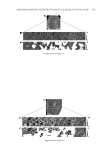
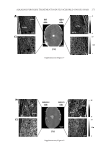
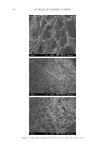
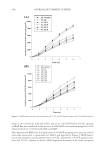
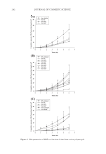
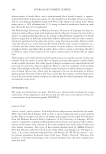
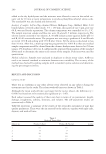
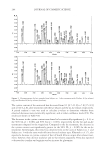
JOURNAL OF COSMETIC SCIENCE 250 Figure 2 contains a photograph showing the position of the replica rings on the inner fore- arm. Also included is an image of a replica in which the active sweat glands produced a protrusion on the surface of the skin resulting in a negative cast on the replica. Therefore, dark large dots in the image correspond to beads of sweat. Using image analysis software, the image can be processed so that dark dots can be isolated on a white background and then counted to determine the number of active glands per unit area. A full study illustrating the effects of climatic conditions, contrast between right and left arms, gender differences, etc. was already published using this technique (13). We found similar results using this ap- proach and, therefore, will not elaborate more on the subject for the sake of brevity. KINETICS OF AXILLAE PERSPIRATION BEHAVIOR We controlled and monitored several environmental parameters and their infl uence on sweat gland activity. Unlike the replica experiments described above, subjects spent 45 min (Test 2) in the sauna chamber during the kinetic studies. The fi rst series of ex- periments involved examining the effect of temperature and humidity on perspiration output. In all experiments (except where indicated), subjects were acclimatized for 30 min at 27°C and 50% RH prior to exposure to the indicated conditions. A typical plot of perspiration vs. time is provided in Figure 3 for both the left and right axillae of one of the subjects. There are two distinct slopes that appear in all of the plots—from time 0 to 20 min, and from time 25 to 45 min. Initially, we attempted to treat the data using quantitative models and several theories of diffusion. Unfortunately, the situation gov- erned by the absorbent pads, which adsorb sweat from the surface of skin, is not accurately depicted by simple diffusion processes. Interestingly, after the infl ection point at 25 min, the plot is characterized by a second slope greater in rate. The reported perspiration rates in this study were determined from measurements of the slope from 25–45 min. Selected Figure 2. (A) Photograph of the volar forearms of a subject containing replica rings placed on a four quad- rant layout. (B) Digital image of a cast from the volar forearm region along with (C) its image processed counterpart containing isolated sweat profusions on a white background (counted). This was the key output parameter for Test 1.
Purchased for the exclusive use of nofirst nolast (unknown)
From: SCC Media Library & Resource Center (library.scconline.org)