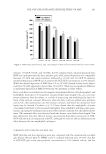
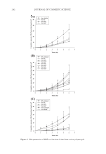
GCL/GCP GELS ENHANCE SKIN DELIVERY OF MAP 279 without statistically signifi cant differences. Simi lar to Milli-Q solution, release rate was further decreased with increasing GCL/GCP concentration in 10% ethanol, and was in- versely correlated to the polymer concentration in the range of 1–3% (p = 0.009 for GCL, and p = 0.079 for GCP). As with a diffusion-controlled release mechanism of gel matrix, it is expected that the greater the gel viscosity the more resistant the gel to drug diffusion, and hence drug release from the matrices would be retarded (22). For all the MAP preparation tested, there was no statistically signifi cant difference in their release rates between two vehicle bases. Although no statistically signifi cant difference was observed between the two polymers, there was a trend shown in 10% ethanol that GCL released more MAP than GCP did. It is likely that the smaller fatty acid chains (lauroyl) can be built more completely into the polymeric chains, thus increasing the free volume holes in the polymer resulting in higher permeability for drug release (23). IN VITRO SKIN PERMEATION AND DEPOSITION OF MAP Skin permeation of MAP from different formulations as a function of time was shown in Figure 4, and their permeation rates were summarized in Figure 5 and Table I. MAP fl ux through nude mouse skin from aqueous solution was similar to that from 1% GC, while skin fl ux was signifi cantly increased 2.86- and 1.58-fold from 1% GCL and GCP, respec- tively, as compared to 1% GC. In 10% ethanol vehicle, MAP fl ux from 10% ethanol solu- tion, 1% GCL, and 1% GCP was 4.13-, 3.96-, and 3.24-fold of 1% GC, respectively. Increase in GCL/GCP concentration has further increased the MAP fl ux to 8.38 (2% Table I Release rate and skin fl ux of 3% MAP from various formulations Release Rate (μg/h/cm2) Skin Flux (μg/h/cm2) Epidermis (μg/g) Dermis (μg/g) Viscosity (cps) Aq. solution 1533.5 ± 30.3 2.32 ± 1.4 12.9 ± 2.4 43.7 ± 3.5 ND 1% GC 1517.9 ± 103.1 2.38 ± 1.5 5.0 ± 2.0 6.5 ± 1.5 945 ± 215 1% GCL 995.0 ± 83.8 6.82 ± 2.3 33.8 ± 9.9 5.2 ± 2.7 675 ± 98 3% GCL 915.4 ± 82.4 ND ND ND 1082 ± 196 1% GCP 1074.5 ± 32.9 3.77 ± 1.9 27.2 ± 8.3 20.6 ± 2.3 1075 ± 192 3% GCP 806.6 ± 178.2 ND ND ND 2485 ± 246 10% ethanol 1292.1 ± 87.1 3.43 ± 2.0 93.1 ± 23.2 82.9 ± 29.2 ND 1% GC 1544.5 ± 67.5 0.83 ± 0.6 27.8 ± 11.6 47.5 ± 22.3 809 ± 20 1% GCL 1340.9 ± 38.2 3.29 ± 1.3 42.6 ± 29.7 89.6 ± 58.9 299 ± 4 2% GCL 1235.5 ± 61.6 6.95 ± 4.5 64.9 ± 56.7 21.6 ± 17.8 ND 3% GCL 1024.2 ± 37.5 11.66 ± 3.2 228.1 ± 92.5 89.4 ± 39.3 512 ± 107 1% GCP 1168.2 ± 114.0 2.69 ± 1.6 26.8 ± 15.4 24.3 ± 18.6 629 ± 88 2% GCP 965.5 ± 91.5 7.32 ± 2.4 186.6 ± 73.8 70.6 ± 48.0 ND 3% GCP 888.7 ± 76.3 10.80 ± 4.7 292.8 ± 99.4 91.8 ± 84.2 1039 ± 86 1% Carbopol ND 0.48 ± 0.1 21.2 ± 10.8 10.1 ± 2.9 12440 ± 219 1% HPMC ND 0.76 ± 0.6 17.2 ± 10.1 20.2 ± 4.0 2520 ± 219 ND: not determined.

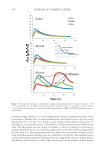
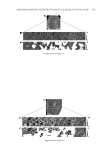
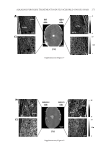
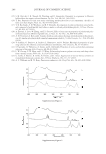
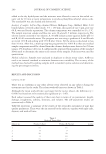
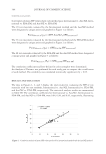
JOURNAL OF COSMETIC SCIENCE 280 GCL), 14.04 (3% GCL), 8.82 (2% GCP), and 13.01 (3% GCP) fold of 1% GC. Increase in MAP fl ux was correlated to the increase in GCL/GCP concentration prepared in 10% ethanol vehicle (p 0.05 for both GCL and GCP). Skin deposition of MAP after 6 h application of 3% MAP preparations in aqueous vehicle onto nude mouse skin is summarized in Table I and depicted in Figure 6. MAP deposi- tion in the epidermis was the greatest from 1% GCL, followed by 1% GCP, aqueous solu- tion, and 1% GC, whereas in dermis, MAP deposition decreased in the order of aqueous Figure 2. MAP release as a function of time from GC, GCL, and GCP gels in water and 10% ethanol vehicles.
Purchased for the exclusive use of nofirst nolast (unknown)
From: SCC Media Library & Resource Center (library.scconline.org)