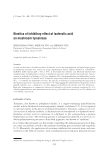
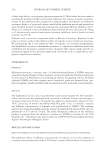
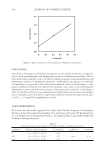
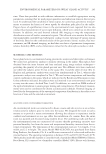
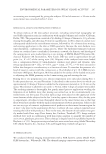
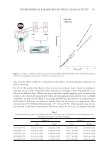
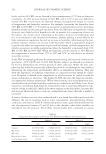
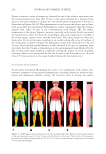
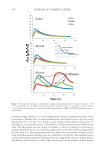
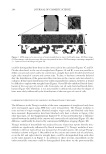
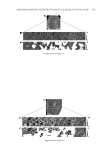
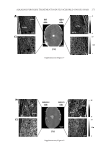
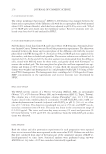
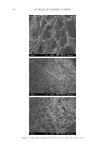
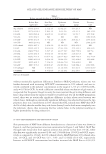
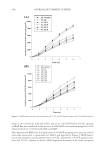
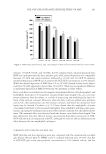
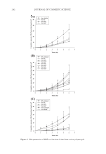
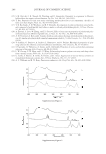
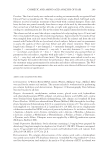
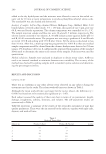
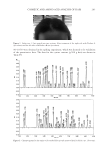
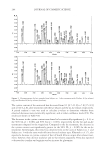
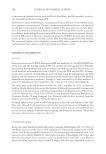
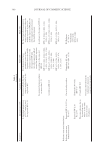
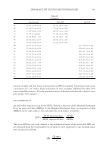
COSMETIC AND AMINO ACID ANALYSIS OF HAIR 293 90–105% were obtained in the spiking experiment, which was deemed to be validation of the quantitative data. The data for the cystine content (g/100 g hair) are shown in Table VI. Figure 1. Subject no. 2, hair parted into two sections. After treatment of the right side with Product A (lye relaxer) and the left side with Product B (no-lye relaxer). Figure 2. Chromatograms for the amino acid standard H (top) and untreated hair for Subject no. 1 (bottom).

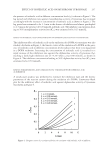
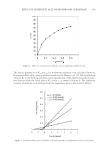
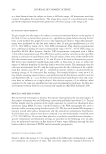
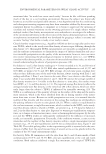
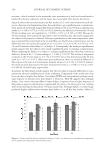
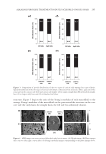
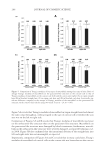
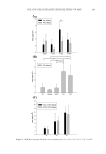
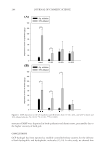
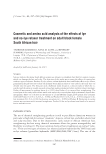
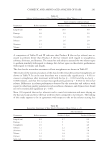
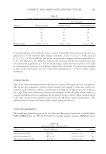
JOURNAL OF COSMETIC SCIENCE 294 The cystine content of the untreated hair decreased from 9.1 [6.7–11.9] to 7.8 [2.5–9.9] and 4.0 [2.9–4.8], after treatment with the lye relaxer and the no-lye relaxer, respectively. A paired student’s t-test was used to calculate p-values to determine whether these observed decreases were statistically signifi cant, and at what confi dence levels (CL). The results are shown in Table VII. The decreases in the cystine content were found to be statistically signifi cant (p 0.1): at the 90% CL (p = 0.086) and 99% CL (p = 0.005), respectively, for the lye and no-lye treatments compared to the virgin hair. Compared to the lye treatment, the decrease in the cystine content was signifi cantly greater (at the 90% CL, p = 0.085) for the no-lye treatment. Interestingly, this trend was observed even in the cases of Subject no. 1 and Subject no. 3 with the same wash-off times for each relaxer type. Khumalo et al. (7), also reported a decrease in cystine content of hair of South African origin after relaxer treat- ment however, they did not study lye and no-lye relaxers separately. They also reported a decrease for citruline and arginine and an increase for glutamine. Figure 3. Chromatograms for hair samples from Subject no. 1 after treatment with Product A (lye relaxer) (top) and Product B (no-lye relaxer) (bottom).
Purchased for the exclusive use of nofirst nolast (unknown)
From: SCC Media Library & Resource Center (library.scconline.org)