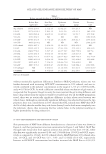
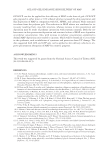
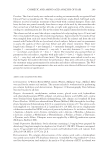
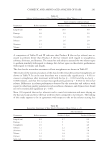
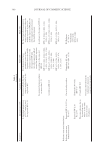
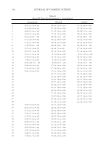
Table III Evaporimetry Results from Acclimatization after Preconditioning Subjects in Cool (6.3°C) and Warm (24.1°C) Environments Subject AVG (=3) pre-equilibration Key data AVG (=3) equilibration time (30.5° 15 min exposure t = 0 min, n = 3 t 60 min, n = 3 1 2 3 1 2 3 1 6.3° RH AVG no. of Maxima 1.0 1.0 1.0 1.3 1.3 1.3 SSWL (gm −2 ) 0.07 ± 0.01 0.05 ± 0.01 0.05 ± 0.01 0.09 ± 0.04 0.06 ± 0.01 0.05 ± 0.01 Flux density (gm−2h)−1 14.5 ± 3.7 11.6 ± 1.7 10.7 ± 0.7 20.1 ± 2.0 15.0 ± 1.3 16.1 ± 0.8 24.1° 28% RH AVG no. of maxima 2.0 1.7 1.3 3.3 2.3 2.3 SSWL (gm−)2 0.15 ± 0.06 0.07 ± 0.02 0.06 ± 0.01 0.31 ± 0.25 0.11 ± 0.05 0.07 ± 0.02 Flux Density (gm−2h)−1 20.6 ± 2.1 15.4 ± 1.0 16.0 ± 2.4 32.5 ± 11.6 17.5 ± 4.6 29.0 ± 20.7 2 6.3° RH AVG no. of maxima 1.0 1.0 1.0 1.0 2.5 2.5 SSWL (gm−)2 0.25 ± 0.17 0.15 ± 0.10 0.09 ± 0.02 0.33 ± 0.11 0.17 ± 0.11 0.16 ± 0.07 Flux density (gm−2h−)1 10.7 ± 4.4 9.2 ± 1.4 9.0 ± 0.9 13.2 ± 1.1 25.1 ± 19.0 18.9 ± 5.5 24.1° 28% RH AVG no. of maxima 1.5 1.5 1.5 4.0 2.3 2.3 SSWL (gm −2 ) 0.27 ± 0.20 0.11 ± 0.06 0.09 ± 0.01 0.55 ± 0.11 0.27 ± 0.16 0.11 ± 0.08 Flux density (gm−2h−)1 12.5 ± 1.2 13.1 ± 0.3 13.2 ± 0.2 40.0 ± 20.2 27.7 ± 23.0 29.6 ± 20 ENVIRONMENTAL PARAMETERS ON SWEAT GLAND ACTIVITY 257

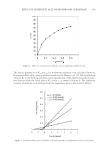
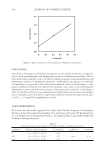
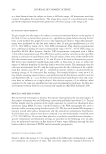
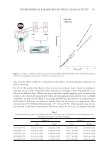
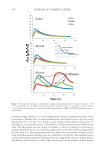
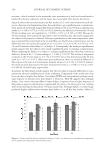
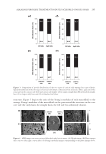
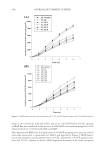
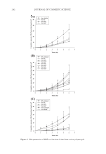
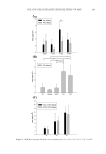
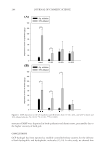
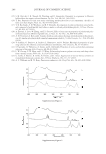
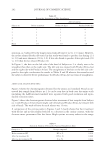
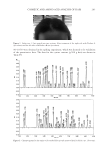
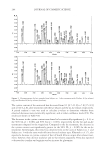
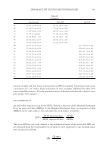
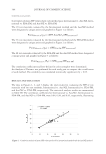
JOURNAL OF COSMETIC SCIENCE 258 maxima—which resulted in the nonsteady-state termination of trials and contributed to higher fl ux density endpoints and the large, but meaningful, fl ux density deviations. Figure 6 refl ects the extracted steady-state fl ux results (n ≥ 2, mid-volar forearm) for each sub- ject as a function of acclimatization time. For each subject, pre-equilibration in a cool environ- ment produced statistically unique fl ux density readings at the 0- and 30-min acclimatization marks (t4 = 3.518 to 3.675 p = 0.021 to 0.024) however, the differences between the 30- and 60-min readings were not signifi cant (t4 = 0.990 to 1.071 p = 0.345 to 0.395). Because the 60-min readings were statistically equivalent to the 30-min fl ux data, the results suggest that the subjects had properly acclimated. After pre-equilibration at the warm temperature, there was an upward directional trend in the recorded fl ux over the 60-min acclimatization yet, the differences were not statistically signifi cant (t4 = 0.329 to 1.212 p = 0.292 to 0.332) at t = 0, 30, and 60 min for either Subject 1 or Subject 2. Consequently, the warm pre-equilibration results suggest that the subjects were nearly equilibrated prior to entering acclimatization. When comparing the Subject 1 vs. Subject 2 cold pre-equilibration data, there was a statistical difference between the t = 0-min readings (t4 = 2.404 p = 0.074). The statistical uniqueness continues at the 30-min mark (t4 = 2.724 p = 0.053), but is only directional at the 60-min mark (t4 = 1.877 p = 0.157). After warm pre-equilibration, there is a statistical difference in fl ux output at the start of acclimatization between subjects (t4 = 2.503 p = 0.067) however, the trends are only directional at the latter measurement times (t4 = 1.058 to 1.413 p = 0.231 to 0.400 for 30 and 60 min, respectively). In general, the fl ux density results suggest that the two subjects respond differently to accli- matization after pre-equilibration in cooler conditions. Comparison of the steady-state data between subjects implies that Subject 1 has higher TEWL and, independently, perhaps a more rapid response to thermal stress than Subject 2. However, Table III suggests that although Subject 1 has a more consistent effl ux of vapor, Subject 2 appears to have a higher frequency of fl ux pulses as proper acclimatization is approached. In practice, the latter point may correlate with trends (nonreported data) from 50 sauna study trials. Although Subject 1 unswervingly produced higher axillae sweat volumes than Subject 2 in all hot box studies, Subject 2 Figure 6. Steady-state fl ux density readings for Subjects 1 and 2 as a function pre-equilibration temperature and acclimatization time (mid-volar forearm, zone 2).
Purchased for the exclusive use of nofirst nolast (unknown)
From: SCC Media Library & Resource Center (library.scconline.org)