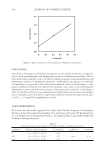
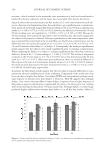
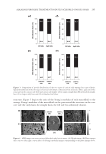
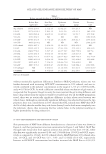
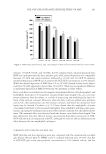
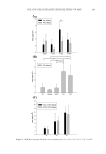
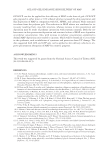
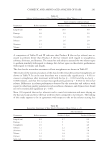
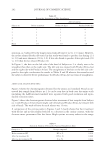
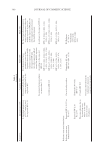
COSMETIC AND AMINO ACID ANALYSIS OF HAIR 291 A comparison of Tables II and III indicates that Product B (the no-lye relaxer) was as- sessed to perform better than Product A (the lye relaxer) with regard to straightness, softness, shininess, and dryness. The researcher and subjects assessed the two relaxer types to perform similarly with regard to damage but did not agree on the relative performance with regard to volume and length. The data for the researcher assessment of hair straightness are shown in Table IV. The results of the statistical analysis of the data for the researcher assessed straightness are shown in Table V. It can be seen that there was a statistically signifi cant (p 0.05) in- crease in straightness after treatment with both the lye (p = 0.016) and the no-lye (p = 0.008) relaxers, and that the increase was signifi cantly greater (p = 0.032) for the no-lye relaxer. Differences in relaxer performance observed by the researcher and subjects with regard to other hair quality parameters such as softness, shininess, and dryness were found not to be statistically signifi cant (p 0.05). Shaw (13) reported that no-lye relaxers tend to cause less irritation and more drying on the hair and scalp and leave the hair with less sheen compared to lye relaxers. The fi nding of this study appears to be in agreement with respect to the no-lye relaxer causing less Table II Subject Self-Assessment of Hair Quality Parameters (Mean Values, n = 5) After treatment with hair relaxer Parameters Before treatment Product A (Lye) Product B (No-lye Length (cm) 8.8 10.0 9.8 Damage 4.8 5.0 5.0 Straightness 3.0 3.4 3.6 Softness 2.0 2.6 2.8 Shininess 2.4 2.6 2.6 Volume 1.2 1.8 1.4 Table III Researcher Assessment of Hair Quality Parameters (Mean Values, n = 5) After treatment Parameters Before treatment Product A (Lye) Product B (No-lye) Length (cm) 8.8 9.7 9.9 Damage 4.4 5 5.0 Straightness 1.6 3 4.0 Softness 1.2 2.2 2.8 Shininess 1.2 2.0 2.8 Volume 1.4 1.8 2.2 Dryness 2.0 2.0 2.4 Split ends 2.6 2.6 2.8

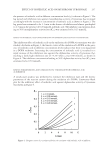
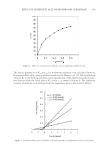
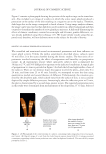
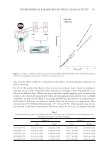
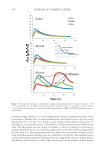
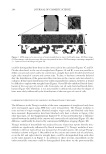
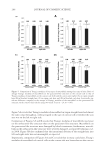
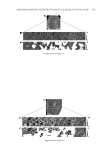
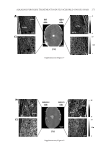
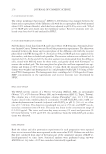
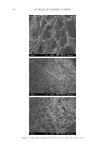
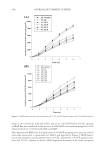
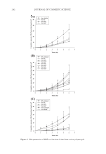
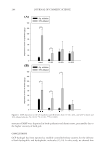
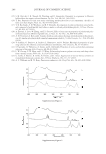
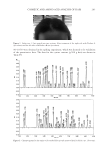
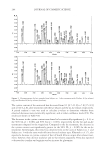
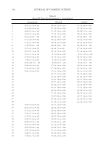
JOURNAL OF COSMETIC SCIENCE 292 irritation, as evidenced by the longer mean wash-off time (14.2 vs. 13.4 min). However, the no-lye relaxer (Product B) tested in this study was found to produce less drying (2.4 vs. 2.0) and more shininess (2.8 vs. 2.0). It was also found to produce fewer split ends (2.8 vs. 2.6) than the lye relaxer (Product A). In Figure 1, the hair on the left side of the head of Subject no 2 is clearly seen to be straighter than that on the right side. The left side was treated with Product B (no-lye) and the right side with Product A (lye). The straightness of the hair on the left side com- pared to the right corroborates the results in Tables II and III wherein the researcher and the subjects observed better performance for Product B (no-lye) in terms of straightness. AMINO ACID ANALYSIS BY RP-HPLC Figure 2 shows the chromatograms obtained for the amino acid standard H and an un- treated hair sample from Subject no.1. It can be seen that in both cases the amino acids (including the AAB internal standard) were separated with good resolution and repro- ducible retention times. Figure 3 shows the chromatograms obtained after treatment of hair samples from Subject no.1 with Product A (lye relaxer) (right side of head) and Product B (no-lye relaxer) (left side of head). The wash-off time for each relaxer was 15 min. A comparison of the cystine peaks in Figures 2 and 3 clearly shows that hair treatment with the lye and no-lye relaxers both led to a decrease in the cystine content, with the decrease more pronounced for the latter. High cystine recovery values in the range Table V Statistical Analysis of Researcher Assessed Straightness Data Group (n = 5) Groups compared p-value Before treatment (BT BT vs. L 0.016 After lye treatment (L) BT vs. N 0.008 After no-lye treatment (N) L vs. N 0.032 Table IV Researcher Assessment of Hair Straightness After treatment Subject no. Before treatment Product A (Lye) Product B (No-lye) 1 1 3 4 2 1 2 4 3 2 3 4 4 2 3 4 5 2 4 4 Mean 1.6 3.0 4.0
Purchased for the exclusive use of nofirst nolast (unknown)
From: SCC Media Library & Resource Center (library.scconline.org)