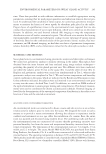
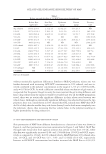
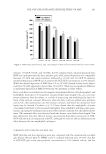
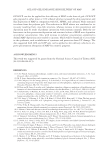
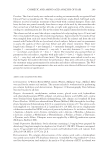
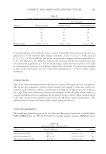
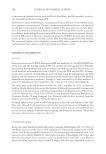
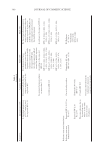
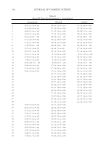
DISPARATE SPF TESTING METHODOLOGIES 303 International FDA-FM Aus/NZ 41 32.8 ± 1.9 (n = 10) 33.4 ± 2.6 (n = 20) 42 11.5 ± 1.3 (n = 10) 11.9 ± 1.2 (n = 20) 43 17.6 ± 1.8 (n = 10) 16.9 ± 1.1 (n = 20) 44 31.1 ± 1.7 (n=10) 33.2 ± 2.2 (n = 20) 45 23.3 ± 4.0 (n = 10) 21.2 ± 2.0 (n = 20) 46 26.4 ± 2.6 (n = 10) 26.9 ± 2.4 (n = 20) 47 11.8 ± 1.8 (n = 10) 12.2 ± 1.3 (n = 20) 48 21.6 ± 3.1 (n = 10) 22.1 ± 6.0 (n = 10) 49 23.2 ± 4.3 (n = 10) 22.6 ± 3.9 (n = 10) 50 28.1 ± 2.3 (n = 10) 28.7 ± 1.7 (n = 10) 51 23.1 ± 2.2 (n = 10) 25.4 ± 4.2 (n = 10) 52 16.2 ± 2.4 (n = 10) 15.6 ± 3.0 (n = 10) 53 18.5 ± 2.7 (n = 10) 16.5 ± 1.9 (n = 10) 54 18.2 ± 2.9 (n = 10) 17.6 ± 1.8 (n = 10) 55 17.0 ± 2.9 (n = 10) 19.9 ± 3.4 (n = 10) 56 16.9 ± 2.0 (n = 10) 17.4 ± 3.2 (n = 10) 57 16.9 ± 2.8 (n = 10) 15.7 ± 1.6 (n = 10) 58 16.0 ± 3.1 (n = 10) 14.5 ± 2.6 (n = 10) 59 22.5 ± 2.6 (n = 10) 24.1 ± 3.4 (n = 10) Table II Continued natural sunlight and that meets international and FDA standards. Irradiation beams were a minimum of 1 cm2 with a beam uniformity of 10%, and they exhibited less than 20% time-related fl uctuation. All solar simulators were calibrated and adjusted to deliver ener- gies within 10% variance. SPF DETERMINATION An individual sun protection factor (SPFi), defi ned as the ratio of the Minimal Erythemal Dose on protected skin (MEDp) to the Minimal Erythemal Dose on unprotected skin (MEDu) on the same subject, was calculated for each subject as follows: = = MEDi (protected skin) MEDpi SPFi MEDi (unprotected skin) MEDui The mean SPF for each trial, defi ned as the arithmetical mean of the individual SPFi val- ues obtained from the total number (n) of subjects used, expressed to one decimal point, was calculated as follows: ¦ ( SPFi) SPF= n

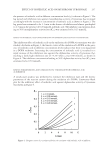
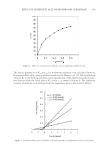
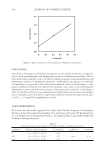
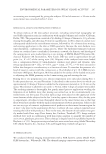
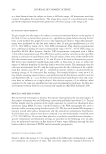
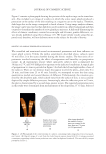
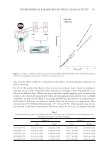
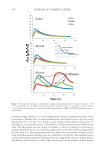
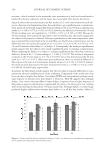
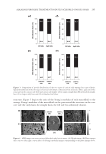
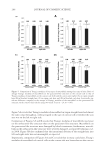
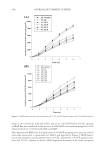
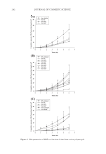
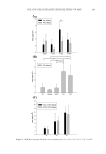
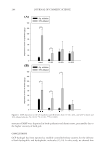
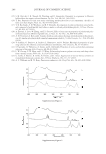
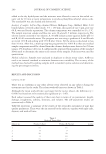
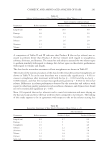
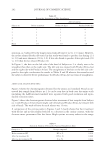
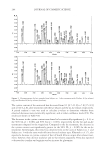
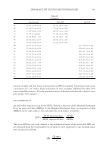
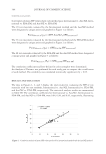
JOURNAL OF COSMETIC SCIENCE 304 Figure 1. Correlation analysis of mean SPF values produced by international method and the Aus/NZ method. STATISTICAL ANALYSES Scatterplots of mean SPF values show each method pair, International vs. Aus/NZ, Inter- national vs. FDA-FM, and Aus/NZ vs. FDA-FM. The 29 test materials evaluated by the International method and the Aus/NZ method were designated a unique point and graphed in Figure 1 as follows: PointMaterial A (pA) = (SPF Aus/NZn,SPFInternational) The 36 test materials evaluated by the International method and the FDA-FM method were designated a unique point and graphed in Figure 2 as follows: PointMaterial A (pA) = (SPFFDA-FM,SPFInternational) The 28 test materials evaluated by the FDA-FM and the Aus/NZ method were designated a unique point and graphed in Figure 3 as follows: PointMaterial A (PA) = (SPFAus/NZ,SPFFDA-FM) The correlation coeffi cients and best-fi t line for each scatterplot were determined. An Analysis of Variance was performed for each study pair to compare the overall mean of each method. The variability was considered statistically signifi cant if p 0.05. RESULTS AND DISCUSSION The data in Figures 1, 2, and 3 display the trial results for evaluating the SPF of test materials with two test methods, International vs. Aus/NZ, International vs. FDA-FM, and Aus/NZ vs. FDA-FM, respectively. The statistical analysis results are summarized in Table III. The correlation coeffi cents for International vs. Aus/NZ, International vs. FDA-FM, and Aus/NZ vs. FDA-FM, were 0.94, 0.99, and 0.95, respectively, illustrating
Purchased for the exclusive use of nofirst nolast (unknown)
From: SCC Media Library & Resource Center (library.scconline.org)