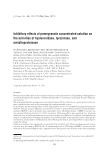
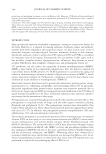
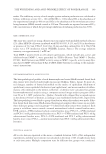
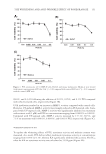
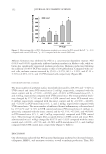
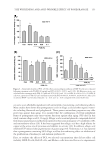
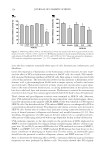
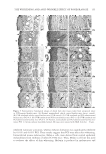
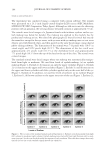
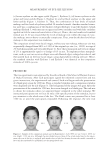
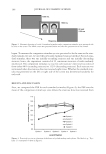
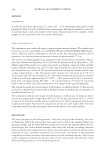
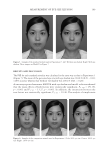
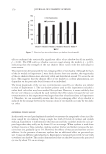
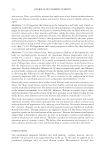
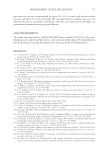
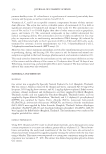
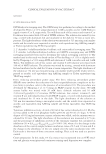
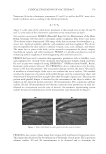
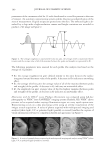
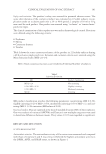
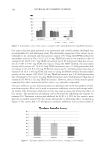
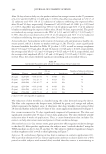
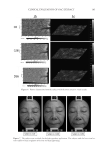
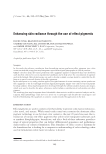
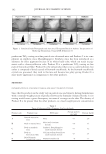
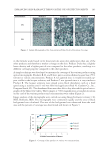
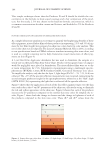
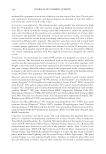
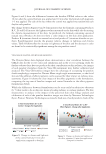
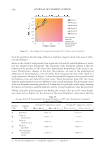
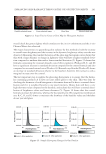
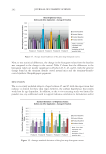
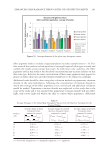
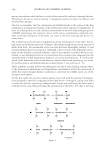
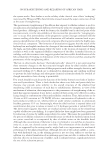
ENHANCING SKIN RADIANCE THROUGH THE USE OF EFFECT PIGMENTS 201 overall cheek has gotten lighter which correlates to the in vitro colorimetry and the in vivo Chroma Meter data observed. The major characteristic to quantifying skin radiance by this method is both the increase in overall mean brightness and the increase in the dynamic brightness values over the area observed. Measuring the standard deviation of the gloss map histogram curves shows that skin with a large dynamic or change in lightness value will have a higher standard devia- tion compared to uniform skin with a lower standard deviation (5). Figure 15 shows that formulas containing the titanium dioxide coated effect pigments (Products B, C, and D) have a signifi cant increase in standard deviation compared to the control formula and also compared to uncoated natural mica (Product A). Bismuth oxychloride (Product E) shows an increase in standard deviation relative to the baseline however, the increase is only a marginal increase over the control. The last important step to analyze the gloss map histograms is to ensure that the formu- las containing products A–E have not just added gloss to the skin. This was done by checking the skewness of each histogram to determine how well it fi ts to a normal distri- bution and if it is weighted heavily to one pixel intensity. Glossy skin will have a very high skewness value compared to the baseline, and radiant skin will have a normal distri- bution of brightness values and lower skewness (5). Figure 16 shows that the control formula increases the skewness, whereas the four pearlescent effect pigments tested (prod- ucts B, C, D, and E) lower or maintain the skewness of the baseline values and therefore do not just add gloss. Figure 12. Steps Used to Create a Gloss Map for Histogram Analysis Figure 13. Sample Histogram Changes for One Panelist

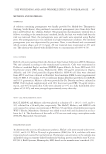
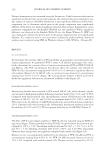
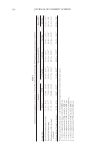
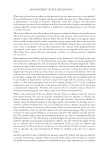
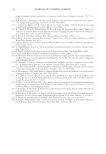
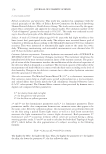
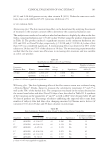
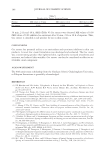
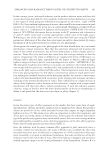
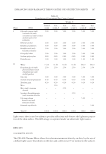
JOURNAL OF COSMETIC SCIENCE 202 Now, to test statistical differences, the change in the histogram values from the baseline was compared to the change in the control. Table V shows that the differences in the histogram values are mostly signifi cant in Products B, C, D, and E, with the greatest change found in the titanium dioxide coated natural mica and the titanium-dioxide- coated synthetic fl uorphlogopite pigments. DISCUSSION The in vivo study included subjects of ages between 45 and 65 with the expectation that radiance is desired for these skin types however, the authors hypothesize that results would not be age dependent. In addition, as the in vivo screening study was limited by panelist size, any additional work to support radiance correlation to formulation and/or Figure 14. Average mean brightness of the gloss map histogram curves. Figure 15. Average standard deviation of the gloss map histogram curves.
Purchased for the exclusive use of nofirst nolast (unknown)
From: SCC Media Library & Resource Center (library.scconline.org)