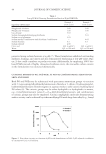
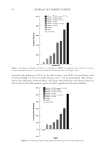
JOURNAL OF COSMETIC SCIENCE 4 RESULTS AND DISCUSSION OPTIMIZATION OF CE CONDITIONS Different buffer solutions such as acetate and phosphate buffers were tried to monitor BAC. According to the certifi cate of analysis of BAC standard, it contains two types of BAC with C10 and C12 derivatives. Due to this situation, two peaks were observed during analysis of standard material and these peaks were investigated simultaneously. When the buffer solution was selected, obtained peaks, shape of peaks, and also peak areas were compared. Phosphate buffer solution was selected as supporting electrolyte after comparing the ob- tained results. A set of experiments was carried out to optimize electrolyte concentration using 25, 50, 75, 100, 200, and 300 mM phosphate buffer as supporting electrolyte. All electrophoregrams, obtained peaks, peak shapes, and peak area values were compared. There was no peak at a concentration value of 300 mM. Hence, obtained electrophoregrams were investigated for other concentration values. Since regular peak shapes were observed, only peak area values were used to compare electrophoregrams versus supporting electrolyte concentration. Peak area values increased with increasing buffer concentration up to 75 mM. However, area values decreased at higher buffer concentrations. For analytical purposes, 75 mM concentration value was selected as phosphate buffer concentration value due to the high- est peak area value. pH is very important parameter for CE. Because the pH value of supporting electrolyte solution changes the capillary inner wall, it provides power of the separation system: elec- troosmotic fl ow. Effect of pH value on determination of BAC was investigated between pH 5 and 8 values. Peaks of C10 and C12 derivatives closed up with increasing pH value. It means that pH value of phosphate buffer solution was effective on resolution of peaks. Beside the peak shape, peak area values were compared and it was seen that the highest peak area value were obtained at pH 6 buffer solution. pH 6 value was selected as sup- porting electrolyte pH value. Temperature affects the mobilities of the substances and also analysis. Different temperature values were investigated by comparing obtained electrophoregrams between 18° and 28°C. It was seen that peak area values decreased when temperature increased to 24°C. But, peak areas increased with increasing temperature after this value. The mean higher temperature values could be selected, but in this situation, Joule effect affecting separation quality cannot be eliminated. As expected, repeated experiments showed that there was a repeat- ability problem at higher temperature values. Thus, low temperature values were more appropriate. Due to all these reasons, 18°C was selected as the working temperature. Starting experiments showed that usage of only buffer solution did not achieve the sepa- ration of BAC species. Consequently, an organic additive was necessary to perform analy- sis. First of all, methanol was tried as organic additive, but remarkable results were not obtained, then another solvent ACN was tried. Due to separation of both BAC species, different ACN percentages were investigated between 10% and 60% and recorded elec- trophoregrams were evaluated. The separation of the peaks was not satisfactory at low ACN percentages of up to 30% due to shapes of the peaks. Peak shapes and peak resolu- tions were better at a ACN percentage of 30%. But the resolution value deteriorated with increasing ACN percentage. For these reasons, ACN percentage of 30% was selected to determine BAC.

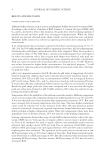
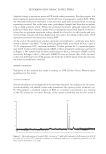
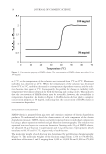
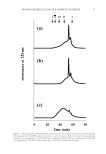
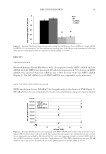
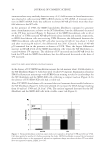
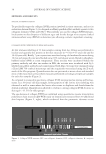
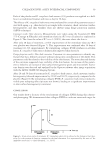
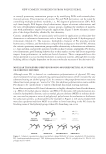
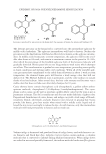
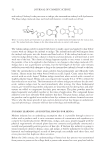
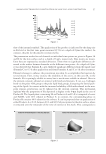
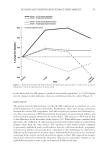
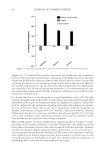
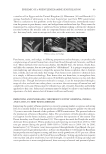
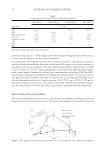
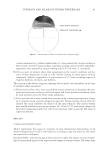
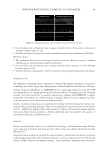
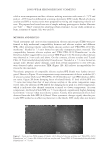
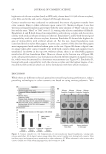
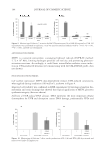
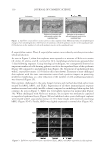
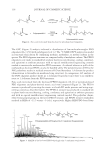
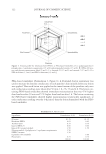
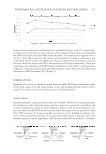
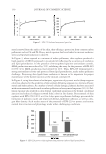
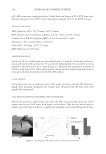
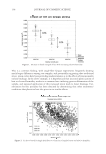
DETERMINATION OF BAC IN WET WIPES 5 Applied voltage is separation power of CE beside other parameters. For this purpose, dif- ferent separation potentials between 5 and 20 kV were investigated to analyze BAC. When the obtained results were evaluated, it was seen that peak areas decreased with increasing separation potential. But at the same time, peak shapes changed and there was no separa- tion at high potential levels. When the potential decreased, although relatively good peak area values were obtained, peaks were not symmetrical and well shaped. It was nec- essary that an optimum separation voltage should be selected to see the regular and sym- metrical shape of peaks and obtain higher peak area values. According to the results, 10 kV separation potential was selected to analyze BAC. At the end of the preliminary studies, optimum electrophoretic conditions were deter- mined as follows—the BGE: 75 mM (pH 6) phosphate buffer mixed with ACN at a ratio of 70:30 temperature: 18°C injection condition: 50 mbar pressure for 3 s separation poten- tial: 10 kV. A typical electrophoregram of BAC at these optimized conditions is presented in Figure 2. We surmise that the fi rst peak belongs to the C10 derivative of BAC and the second one belongs to the C12 derivative of BAC because we assume that, of the two mol- ecules only differing by two CH2 groups, the molecule with the larger molecular mass has the lower electrophoretic mobility. METHOD VALIDATION Validation of the method was made according to USP (United States Pharmacopeia) guidelines for this study. SYSTEM SUITABILITY System suitability test was applied for the developed method. According to the literature, system suitability test should contain some parameters like capacity factor, resolution, etc. For this purpose, a standard solution of BAC at a medium concentration was injected to the CE system for six times. Results of the system suitability test for this study is Figure 2. Electrophoregram of standard BAC solution in 75 mM (pH 6) phosphate buffer mixed with ACN at a ratio of 70:30 at 18°C injection condition = 50 mbar pressure for 3 s separation potential = 10 kV. Detection by absorbance at 214 nm.
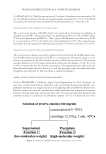
Purchased for the exclusive use of nofirst nolast (unknown)
From: SCC Media Library & Resource Center (library.scconline.org)