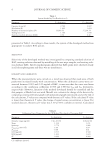
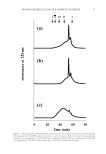
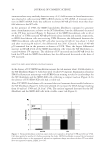
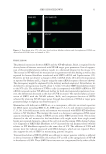
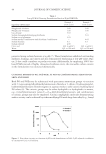
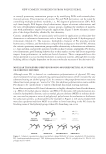
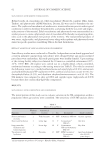
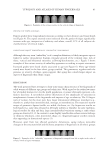
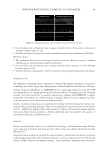
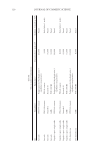
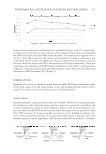
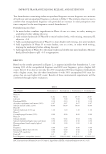
JOURNAL OF COSMETIC SCIENCE 6 presented in Table I. According to these results, the system of the developed method was appropriate to analyze BAC species. SELECTIVITY Selectivity of the developed method was investigated by comparing standard solution of BAC, wetting solution obtained by wrinkling of the wet wipe samples, and wetting solu- tion without BAC. All electrophoregrams showed that BAC peaks were observed clearly in all electrophoregrams and there was no interference. LINEARITY AND CALIBRATION When the preexperiments were carried on, a trend was observed that peak areas of both peaks were increased linearly with concentration. When the calibration curves were con- structed between 0.003 and 0.25 mg/ml of BAC, it was seen that the curve was linear according to the correlation coeffi cients (0.999 and 0.989 for C10 and C12 derivatives, respectively). However, linearity of the method developed should be controlled and for this purpose, a Mandel test was used. Mandel test evaluates the change of the data sets by comparing constructed linear graph with polynomial graph statistically and at the end of the calculations, F values are compared with theoretical F values. If the calculated F value is lower than theoretical F value, the change of signal versus concentration is linear. For studied data set, theoretical F value was 5.59 at 95% confi dence interval. Calculated Table I System Suitability Test Results (n = 6) Parameter C10 derivative C12 derivative Capacity factor (k') 2.700 2.837 Resolution (R) 1.605 1.605 Number of theoretical plates (N) 34,803.54 37,240.78 Tailing factor (T) 1.100 1.050 Relative standard deviation (RSD) 0.56 0.46 Table II Calibration Curve Parameters for the CE Method Developed to Determine BAC Parameter C10 derivative C12 derivative Dynamic range (μg/ml) 1.96–165.50 0.98–82.00 Slope 1.216 1.231 Intercept 2.779 1.986 Ftheorethical (95% CI) 5.59 5.59 Fcalculated -0.98 0.01 LOD (μg/ml) 0.313 0.309 LOQ (μg/ml) 1.042 1.029 R2 0.999 0.989 CI: confi dence interval.

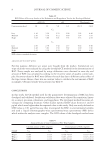
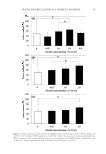
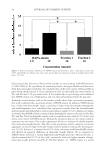
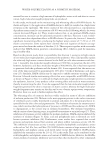
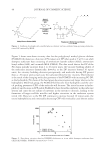
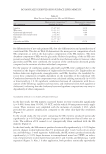
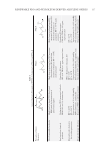
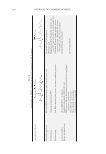
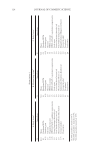
DETERMINATION OF BAC IN WET WIPES 7 F values were -0.981 and 0.011 for C10 and C12 derivatives, respectively, by using Mandel test. This situation showed statistically that peak area values of BAC derivatives increased linearly with increasing concentration. In light of this information, calibration curve parameters were evaluated. Resulted parameters are presented in Table II. ACCURACY AND PRECISION Accuracy and precision of the developed method were evaluated at means by recovery and relative standard deviation, respectively. For this purpose, quality control solutions of BAC were investigated. Recovery studies were made by using wetting solution without BAC. Known amount of standard BAC solutions were added to this solution at three dif- ferent concentration levels and analyzed. Recovery values and relative standard deviations for intraday and interday studies are shown in Table III. According to Table III, there were some differences between recovery values. The reasons may be due to little deviations from calibration curve at high and low concentration values. Although these concentration values seem in the linear range according to the Mandel test, in view of recovery studies there were some differences. But this situation did not affect the wet wipe analysis because analysis of the samples was applied at medium concentration value. To evaluate the precision of the developed method, standard solutions of BAC at three different levels were investigated. Retention time and peak area values were compared for both intraday and interday precision study. All results met the validation conditions. ROBUSTNESS AND RUGGEDNESS OF THE METHOD Robustness and ruggedness of the method were investigated. For this purpose, some parameters of the method were changed deliberately as declared in USP between ±10% rate. These parameters were percent of ACN in supporting electrolyte, pH value of sup- porting electrolyte, and wavelength of the detector. Measurements were done in triplicate on different days. All results obtained are presented in Table IV. Table III Calculated Recovery and RSD Values for Known Concentration of BAC at Different Concentrations Concentration Level Intraday Interday C10 derivative C12 derivative C10 derivative C12 derivative R RSD R RSD R RSD R RSD Low 109.34 3.15 112.25 4.34 106.26 3.05 108.34 4.26 Medium 98.81 0.52 98.67 0.74 98.95 1.03 98.32 1.01 High 105.91 1.20 107.89 4.44 103.05 2.77 104.66 3.08 R: recovery % RSD: relative standard deviation of the results. Low, medium, and high concentration values were selected as 0.0075, 0.06, and 0.2 mg/ml BAC.
Purchased for the exclusive use of nofirst nolast (unknown)
From: SCC Media Library & Resource Center (library.scconline.org)