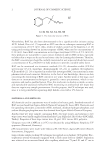
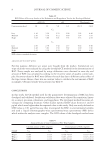
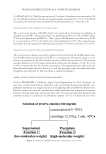
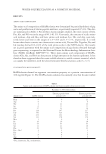
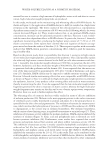
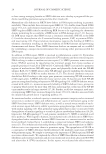
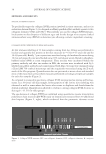
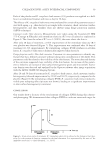
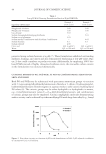
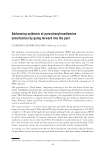
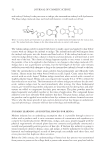
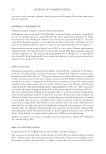
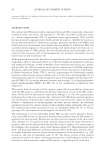
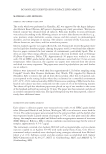
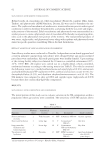
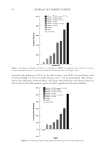
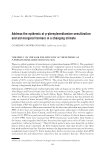
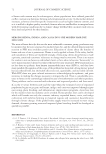
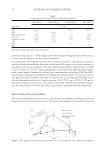
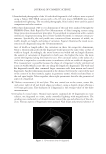
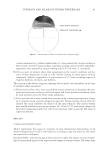
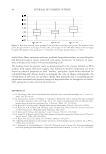
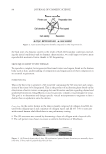
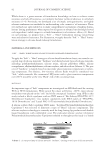
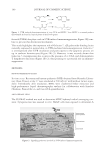
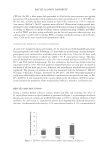
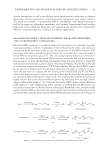
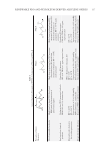
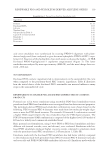
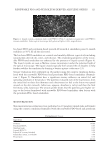
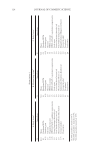
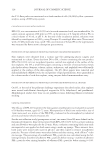
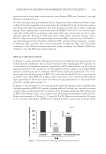
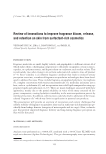
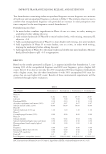
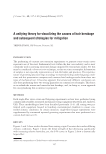
TYPOLOGY AND ATLASES OF HUMAN FINGERNAILS 81 certain conditions (e.g., luluna, leukonychia, etc.) were assessed by categorical choices. The severity or level of vertical ridges, nail shine, peeling, and an overall “unhealthy” appearance were assessed by using an analog scale of 0–5 (0, none, 5, extremely). D) Self-assessments of subjects about their agreements on the overall conditions and fea- tures of their fi ngernails as well as “like–dislike” feeling on some aspects of their fi ngernails. Subjects responded to a questionnaire of 25 items including aspects of fragility, hardness, thickness, and dullness. The creation of the atlases, using the typology data acquired, was dependent on the type of attribute under assessment: 1) Dimensional attribute atlases were created from statistical analysis to determine the max- imum and minimum values as well as the upper and lower quartile and median values for each attribute across the entire study population. 2) Visual attribute atlases were created from assessments by consumer perception of images on a computer using a paired comparison approach. Sixteen women of each ethnicity assessed the visual attributes for subjects of the same ethnicity. The sixteen women were equally divided across two age groups: 18–30 and 31–55 years of age. Images for the paired comparison study were selected to represent values across the full range of expert assessments. RESULTS OVERALL MEASUREMENT RANGES Table I summarizes the ranges of variations of some dimensional characteristics of all observed fi ngernails (10 nails × 280 subjects), according to age and ethnicity. All values are expressed in millimeter. Data from Table I indicate that age or ethnicity are of a rather low impact on most morpho- logical criteria with regard to the respective low ranges of averaged values. The rather large Figure 2. Illustrations of radius of curvature and nail apex height.

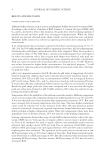
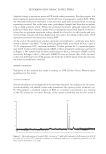
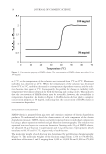
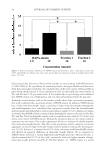
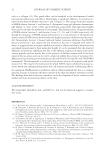
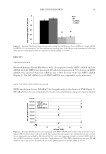
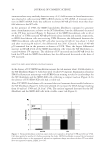
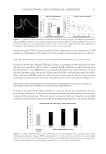
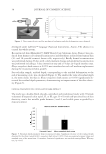
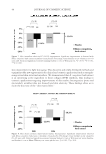
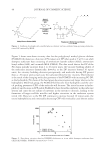
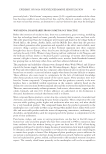
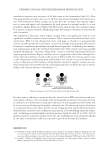
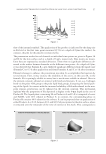
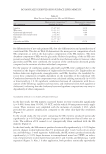
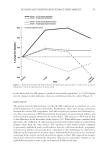
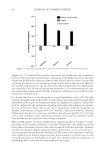
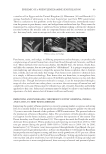
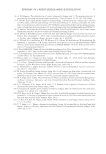
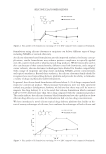
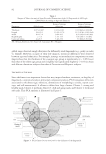
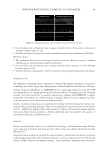
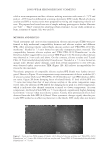
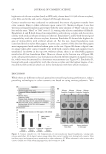
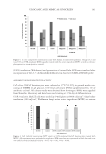
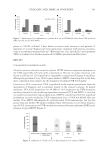
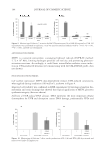
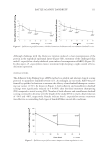
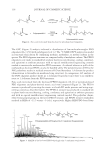
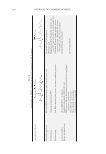
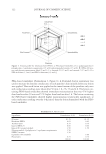
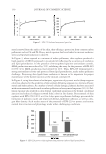
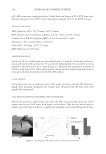
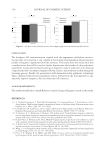
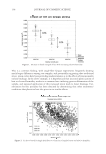
JOURNAL OF COSMETIC SCIENCE 82 global range observed simply illustrates the differently sized fi ngernails (e.g., pinky or index vs. thumb). However, in spite of their low impacts, statistical differences were observed between ages and ethnicities. For example, interage or interethnicity comparisons on same fi ngers show that the thickness of the youngest age group is signifi cantly (p 0.05) lower than that of the oldest age group and is slightly but signifi cantly higher (p 0.05) in Asian and African–American subjects than that of Caucasian and Hispanic subjects. THICKNESS OF THE NAIL Since thickness is an important factor that may impact hardness, resistance, or fragility of fi ngernails, a statistical analysis (principal component analysis, PCA) integrates all factors associated to thickness (age, ethnicity, dimensions of morphologic criteria, expert scor- ings, and self-assessments). It allows to defi ne four large clusters: Cluster 1: strong and healthy nails, Cluster 2: medium, Cluster 3: dull and aging nails, and Cluster 4: weak and soft nails. This PCA analysis is illustrated in Figure 3. Table I Ranges of Values (in mm) of Some Recorded Dimensions of the 10 Fingernails of All People (2800 Nails) According to Age and Ethnicity Parameter Global range Range of average values/age Range of average values/ethnicity Thickness 0.074–0.967 0.341–0.381 0.341(HI)–0.381(AS) Length 9.8–20.3 13.06–13.76 13.15 (CA)–14.05 (AA) width 8.4–12.4 9.84–10.3 9.93 (AS)–10.46 (AA) Depth/height 2–4.5 3.19–3.34 3.06 (AS)–3.44 (AA) Curvature radius 4.4–8.5 5.46–5.91 5.6 (HI)–5.82 (CA) AA: African–American AS: Asian CA: Caucasian HI = Hispanic. Figure 3. PCA of most factors associated to the thickness of the fi ngernails.
Purchased for the exclusive use of nofirst nolast (unknown)
From: SCC Media Library & Resource Center (library.scconline.org)