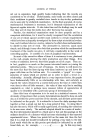
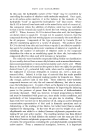
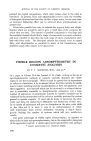
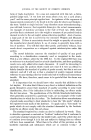
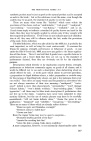
JOURNAL OF THE SOCIETY OF COSMETIC CHEMISTS of surface-active material in the mixture and on the energy transferred from the dispersing apparatus. It is to be expected that the particles will vary either side of the mean size, distributed so that the greater the distance from the mean, the smaller the number of particles at that distance. Thus, if a frequency curve of the distribution were to be drawn, it would be expected to be of the type shown in the distribution curve of Figure 1. It should be noted that particle surface and not particle diameter has been used as the measure of particle size. This has been done because the energy required to form the particle is proportional to the interfacial surface and the incre- ments of energy are likely to be the basic factors distributed either side of their mean: by using particle surface we are indirectly using energy of formation. The number of particles of any surface area at a given distance from the mean will be produced by chance (unless the emul- I UNITS OF PARTICLE SUP, FACE. I FIG. 1 sion has been subjected to some selective treatment such as screening), and the distribution curve will approximate to the Gaussian, or normal, curve more and more closely as a larger number of particles is examined. In that event, the cumulative number of particles smaller (or larger) than a given size will be represented by the area under the normal curve enclosed up to (or beyond) the given particle size--e.g., the shaded part of Figure 1 represents a cumulative number of particles smaller than six units of surface. Now the values of these areas have been tabulated in terms of the devia- tion, expressed as a fraction of the standard deviation of the whole distri- bution, from the mean and the frequency with which the deviation occurs by chance. Since these areas are distributed about the mean, 50 per cent will be positive and 50 per cent negative values, but in order to avoid negative values, which are inconvenient in calculations, 5.0 has been added to all of the area values to give what are called "Probits." We have suggested that the important particle dimension is probably its surface. In a dilute emulsion, the particles will be spheres, in which case their surface, S, equals ,rD •, where D is the diameter. Conversion to logarithms gives log S = 2 log D q- log x and thus by using a log (dia- meter) scale as a measure of particle size we have automatically transformed the diameters to values proportional to the surfaces. It is shown later that these premises are correct. 160

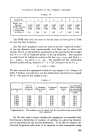
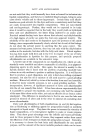
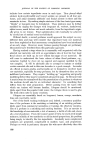
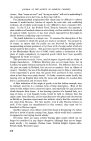
STATISTICAL METHODS IN THE COSMETIC INDUSTRY The analytical technique follows: The data of their Table 2 is first rearranged to show the cumulative percentages of particles smaller than the upper limit of their size range, to give our Table I. TABLE I Particle Size Distribution of the Different Emulsions Source: Ref. 12. Particle % smaller than the stated size Diameter. Sample No. Microns 1 2 I 3 4 5 6 7 1.9 58.4 53.8 42.2 46.3 57.0 37.3 23.6 3.9 78.7 77.7 66.2 75.6 79.6 61-8 67.2 5.9 84.2 85.2 76.3 85.6 84.8 74-1 85.6 7.9 88.3 89-4 82.2 90.6 87.8 82.9 92.1 9.9 90.9 92.1 86.0 93.9 90-4 87.8 95.4 11.9 92.2 93-5 88.7 95.2 92.2 90.3 96.1 GRAPHICAL ANALYSIS These results can be plotted on log-probability paper, putting the particle diameter on the log scale and the cumulative per cent smaller on the probability scale. This gives graphs similar to that shown for two emulsions (Nos. 3 and 1) in Graph 1 and from which can be read the mean effective 10 •0 50 70 90 20 40 60 80 GRAPH 1 os 04 Oa x o 4 S S 0 S,S e,o e s GRAPH 2 161
Purchased for the exclusive use of nofirst nolast (unknown)
From: SCC Media Library & Resource Center (library.scconline.org)