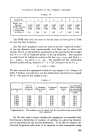
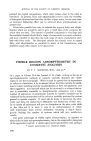
JOURNAL OF THE SOCIETY OF COSMETIC CHEMISTS ARITHMETICAL ANALYSIS In the above analysis we have employed an equation to a line fitted to points by eye and have introduced errors thereby. It is possible to improve upon this by an arithmetical procedure which should be used when the points are too irregular to draw a satisfactory line to by eye. This makes use of a weighted expected probit called a "working probit," taken from the expected probit read from a provisional line. Finney, TM Fisher and Yates •8 and Bliss TM give tables for the easy calculation of the working probit. We will use Finney's Table IV for our source of working probit, again using Sample No. 3. We calculate the successive columns in Table VIII. TABLE VIII No. of Expec- Working Log particles probit probit dia- exam- meter ined nw nwx nwx • nwy nwy • nwxy • n Y y 0.279 2,000 4.85 1,260 352 98 4.80 6,048 29,030 1,687 0'591 2,000 5'39 1,202 711 420 5'42 6,515 35,311 3,850 0'771 2,000 5'71 1,060 817 630 5'72 6,063 34,680 4,676 0'898 2,000 5'91 936 841 755 5'92 5,541 32,878 4,977 0'996 2,000 6'08 824 820 817 6'08 4,986 30,315 4,967 1'076 2,000 6'23 720 775 834 6'21 4,472 29,882 4,812 -- TOTALS 6,002 4,316 3,554 33,625 192,096 24,969 Note ß Up to and including the column nwx • the calculations are identical with the graphical procedure summarised in Table VII. We now calculate the mean value of x, •, = Y•nwx/2:nw and of y, •7, ---- Y•nwy/2:nw the sums of squares and products about the mean, i.e, Znw(x- •)•= Znwx • -- (Znwx)•/Znz• Znw(y-g)•= Znwy•--fZnwy)'[•' nw and Znw (x-•) (y -- g) = Znwxy -- (r•nwx) (r•nwy)/Znw. We have ß ß = 4,316/6,002 ---- 0.719 g----- 33,625/6,002 = 5.602 Y•nw (x -- :•)•: 3,554 -- 4,3162/6,002 ---- 3,554 -- 3, I02 = 452 Y. nw (y -- g)•---- 192,096 --33,6252/6,002- 192,096 -- 188,377 = 3,719 Zn, (x - - g) = 24,969 - (4,313) (33,625)/6,002 = 24,969 - 24,163 = 806 The constant b (called the regression coefficient) of the equation Y = a -t- bX, is Znw(x -- •)CY -- g)/Znw(x -- •)• = 806/452 = 1.783 and the best line is Y = 5.602 q- 1.783 (x -- 0.719) = 4.320 q- 1.783x. By using the equation to calculate the values of Y at the values of x actually used, we can find • in exactly the same manner as shown in 166

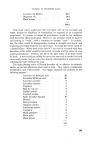
STATISTICAL METHODS IN THE COSMETIC INDUSTRY connection with Table VI, we obtain X 2 (4df) = 3.64 for which p: 0.46. Thus the data does not provide evidence for supposing that the probit/log. diameter relation does not represent the data. The arithmetical calculation has slightly improved the fit of the line to the data. If (2 is considerably improved, but still not satisfactory, the arithmetical calculations are repeated, this time by basing the expected probit on the equation derived from the arithmetical calculations. This process of successive approximations is continued until x 2 ceases to change appreciably and the best fitting equation found thereby. Log ED50 is now calculated from the equation, m = ß -- (5 --g)/b = 0.719 q- (5 -- 5.602)/1.783 = 0-381 and, as calculated earlier, its variance is (1/Znw q- (m--•)2/2 nw(x -- •)2)/b2 :•.: (1/6,002 q- 0.114/452)/1.7832 ---- 0.000131, and consequently s m ----- 0.016. We can compare the 0.381 with the 0.366 previously found graphically and also the 0.016 with the previous 0.192. The variance of the mean probit, g, = 1/Ynw and of the regression coefficient, b, -• 1/Lnw (x -- •)2. In this case V(g) = 1/6,002 and V(b) -- 1/452--i.e. 0'00017 and 0.00221 respectively. Thus g = 5.602 ñ 0.013 and b = 1.783 • 0.047. It is recommended that the reader work through one or more of the other sample distributions in order to familiarise himself with the mechanics of the calculations. DISCUSSION It has been shown that the particle size distribution of the emulsions under discussion can be described by a probit-log diameter regression line and that each emulsion can be defined by its ED50 (Effective Diameter 50 per cent) point and by the slope of the regression line. The latter is the inverse of the estimated standard deviation of the distribution of log diameters. The emulsions can be classified as follows ß Sample No.: 5 1 2 4 3 6 7 -- ED50, Log Microns 0.095 0.106 0.204 0.260 0.366 0.435 0.463 Log s 0.675 0.654 0.538 0.485 0.582 0.538 0.318 The standard deviation for the mean log ED50 of Sample No. 3 has been shown to be 0.016. If we assume that the S.D. of the other means will be of this order, say, 0.02, then the variance of the difference between the log ED50 values of any pair of samples will be (0.02) 2 q- (0-02) 2 = 0'0008, from which s for the differences will be 0.026. On this basis samples with log ED50 further apart than 0.052 will differ significantly with p = 0.05. 167
Purchased for the exclusive use of nofirst nolast (unknown)
From: SCC Media Library & Resource Center (library.scconline.org)