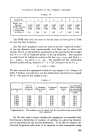
STATISTICAL METHODS IN THE COSMETIC INDUSTRY are presented to the eye in proper form, correlation of many factors can readily be perceived by the eye at a speed which more orthodox methods can detect, but only long after the events have happened. In viewing the chart it is well to bear in mind that production in a factory is not an experiment carried out with that meticulous care which is exercised, or should be, in the actual laboratory and that variations are inevitable. Many of these are not within the ambit of precise control, so that the results of the majestic experiment can only be interpreted when the number of batches is large. In making observations of any series of figures, one must always have in mind what they individually mean. For example, pH values. Too often they are looked on as ordinary figures and variations are interpreted quite wrongly. To take an arithmetical mean except in certain cases in quite wrong since the pH scale is logarithmic. The mid-point between pH 7.5 and 6.5 may be 7, but half-way between pH 4 and pH 5 is certainly not 4.5. It is more like 4.26. The pH unit describes an order of magnitude and the absolute magnitude of a difference in pH value varies according to the position on the pH scale. All values and all things must be looked at in relation to their probable accuracy, their environment and their relative value. With this in mind perhaps my listeners may be asking themselves why they are looking at me ? STATISTICAL METHODS IN THE COSMETIC INDUSTRY: PART III By A. W. MIDDLETON, B.Sc., PH.D., F.R.I.C.* THE USE OF PROBIT ANALYSIS IN THE DEFINITION OF THE PARTICLE SIZE OF AN EMULSION PROBIT ANALYSIS was described in Part II of this series • and subse- quently Stanko, Fiedler and Sperandio•' have published data (Table 2 of their article, p. 43) showing the particle size distribution of seven different emulsions. Their data can be used to provide a more detailed example of the application of probit analysis than that given in Part II, and to show how the particle size of emulsions can be defined by the mean size and the standard deviation of the distribution of log diameters. An emulsion consists of a number of globules of liquid suspended in another liquid in which it is insoluble. When it is manufactured, the sizes of the globules are arbitrarily determined, dependent upon the concentration * Chesebrough Manufacturing Co., Ltd., London, N.W. 10. 159

STATISTICAL METHODS IN THE COSMETIC INDUSTRY are presented to the eye in proper form, correlation of many factors can readily be perceived by the eye at a speed which more orthodox methods can detect, but only long after the events have happened. In viewing the chart it is well to bear in mind that production in a factory is not an experiment carried out with that meticulous care which is exercised, or should be, in the actual laboratory and that variations are inevitable. Many of these are not within the ambit of precise control, so that the results of the majestic experiment can only be interpreted when the number of batches is large. In making observations of any series of figures, one must always have in mind what they individually mean. For example, pH values. Too often they are looked on as ordinary figures and variations are interpreted quite wrongly. To take an arithmetical mean except in certain cases in quite wrong since the pH scale is logarithmic. The mid-point between pH 7.5 and 6.5 may be 7, but half-way between pH 4 and pH 5 is certainly not 4.5. It is more like 4.26. The pH unit describes an order of magnitude and the absolute magnitude of a difference in pH value varies according to the position on the pH scale. All values and all things must be looked at in relation to their probable accuracy, their environment and their relative value. With this in mind perhaps my listeners may be asking themselves why they are looking at me ? STATISTICAL METHODS IN THE COSMETIC INDUSTRY: PART III By A. W. MIDDLETON, B.Sc., PH.D., F.R.I.C.* THE USE OF PROBIT ANALYSIS IN THE DEFINITION OF THE PARTICLE SIZE OF AN EMULSION PROBIT ANALYSIS was described in Part II of this series • and subse- quently Stanko, Fiedler and Sperandio•' have published data (Table 2 of their article, p. 43) showing the particle size distribution of seven different emulsions. Their data can be used to provide a more detailed example of the application of probit analysis than that given in Part II, and to show how the particle size of emulsions can be defined by the mean size and the standard deviation of the distribution of log diameters. An emulsion consists of a number of globules of liquid suspended in another liquid in which it is insoluble. When it is manufactured, the sizes of the globules are arbitrarily determined, dependent upon the concentration * Chesebrough Manufacturing Co., Ltd., London, N.W. 10. 159
Purchased for the exclusive use of nofirst nolast (unknown)
From: SCC Media Library & Resource Center (library.scconline.org)