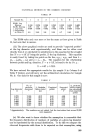
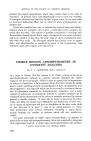
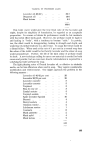
STATISTICAL METHODS IN THE COSMETIC INDUSTRY connection with Table VI, we obtain X 2 (4df) = 3.64 for which p: 0.46. Thus the data does not provide evidence for supposing that the probit/log. diameter relation does not represent the data. The arithmetical calculation has slightly improved the fit of the line to the data. If (2 is considerably improved, but still not satisfactory, the arithmetical calculations are repeated, this time by basing the expected probit on the equation derived from the arithmetical calculations. This process of successive approximations is continued until x 2 ceases to change appreciably and the best fitting equation found thereby. Log ED50 is now calculated from the equation, m = ß -- (5 --g)/b = 0.719 q- (5 -- 5.602)/1.783 = 0-381 and, as calculated earlier, its variance is (1/Znw q- (m--•)2/2 nw(x -- •)2)/b2 :•.: (1/6,002 q- 0.114/452)/1.7832 ---- 0.000131, and consequently s m ----- 0.016. We can compare the 0.381 with the 0.366 previously found graphically and also the 0.016 with the previous 0.192. The variance of the mean probit, g, = 1/Ynw and of the regression coefficient, b, -• 1/Lnw (x -- •)2. In this case V(g) = 1/6,002 and V(b) -- 1/452--i.e. 0'00017 and 0.00221 respectively. Thus g = 5.602 ñ 0.013 and b = 1.783 • 0.047. It is recommended that the reader work through one or more of the other sample distributions in order to familiarise himself with the mechanics of the calculations. DISCUSSION It has been shown that the particle size distribution of the emulsions under discussion can be described by a probit-log diameter regression line and that each emulsion can be defined by its ED50 (Effective Diameter 50 per cent) point and by the slope of the regression line. The latter is the inverse of the estimated standard deviation of the distribution of log diameters. The emulsions can be classified as follows ß Sample No.: 5 1 2 4 3 6 7 -- ED50, Log Microns 0.095 0.106 0.204 0.260 0.366 0.435 0.463 Log s 0.675 0.654 0.538 0.485 0.582 0.538 0.318 The standard deviation for the mean log ED50 of Sample No. 3 has been shown to be 0.016. If we assume that the S.D. of the other means will be of this order, say, 0.02, then the variance of the difference between the log ED50 values of any pair of samples will be (0.02) 2 q- (0-02) 2 = 0'0008, from which s for the differences will be 0.026. On this basis samples with log ED50 further apart than 0.052 will differ significantly with p = 0.05. 167

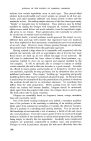
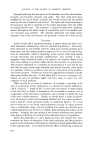
JOURNAL OF THE SOCIETY OF COSMETIC CHEMISTS We see that the samples can be grouped as Nos. 5 and 1 having the smallest particles, Nos. 2, 4, :3 as differing from each other and from 6, 7 which form a pair with the largest mean particle size. However, the other characteristics studied of the emulsions do not appear to have any connec- tion with their particle size distributions as measured by the technique employed by the authors. It is suggested that probit analysis provides a means of specifying the particle size distribution of emulsions. It gives their ED50 value, and its standard deviation, and can define the relation between diameter and number of particles of that diameter. Unless the experimental results are very erratic the distribution can be analysed simply by graphical means. Since it is most likely that particle size is related to the supply of orientated molecules at the particle surface it would be preferable to work with particle surface instead of particle diameter. As particle surface---- •(diameter) 2 it will give a linear probit-log surface graph. It would be expected that the numbers of particles of any selected size would be distributed by chance about a mean size: that the mean size would partly depend on the concentration of surface-active material at the oil/water interfaces and partly on the extent to which the mechanical treat- ment had made use of the surface-active material in dispersing the oil phase: that the range of particle sizes, and thus the value of the constant b used in the probit-log diameter regression line, would depend on the type of mechani- cal treatment (for instance, one would expect an apparatus which depends on pulsating feed pressures developed by a piston to give a greater range of particle sizes than one which functions with an even, non-pulsating feed). We have shown that the particle size distribution is, in fact, represented by a chance distribution and the investigation of the effects of the above factors can be helped by the use of this analytical technique. REFERENCES •0 Finney, D. J., Probit Analysis, Cambridge University Press. n Middleton, A. W., J.S.C.C., IV, 1953, p. 232. •2 Stanko, G. L., Fiedler, %V. C., and Sperandio, G. F., "The Effect of Physical Factors on the Formation of Cosmetic Emulsions," J.S.C.C., V., 1954, p. 39. •8 Fisher, R. A., and Yates, F., "Statistical Tables for Biological, Agricultral and Medical Research." •4 Bliss, C. I., Ann. of Applied Biology, 22, 1935, p. 138 Quat. j•. Pharmacy & Pharmacology, XI, 1938, p. 192. 168
Purchased for the exclusive use of nofirst nolast (unknown)
From: SCC Media Library & Resource Center (library.scconline.org)