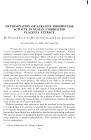
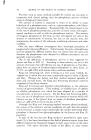
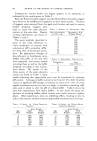
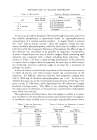
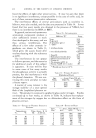
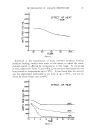
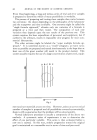
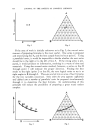
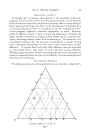
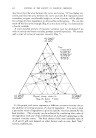
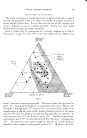
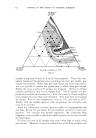
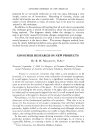
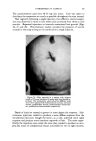
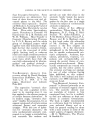
USE Ol• TERNARY DIAGRAMS 463 Before going deeper into the discussion of this method, the nature of the variables subsequently to be demonstrated with various graphs must be explained. It should be understood that the particular variables under consideration are always only a few chosen from the many possible in any cosmetic formula. They may be proportions of ingredients or measurements of physical properties of interest. Thus the values that may be assigned to the variables, X and Y in Fig. 1 represent only their proportion or relationship to the whole composition, while the picture formed by the graph will represent the variation of some measurable physical effect characteristic of the whole formula under in- vestigation. To put it more simply, X and Y may be percentages of concentration of two major ingredients in a complex formula, while the graph may represent over-all changes in a physical property such as vis- cosity, emulsion stability, clarity, etc. Our concern is to arrive at the area of the most desirable physical property under evaluation as determined by the variables, X and Y. This should be accomplished in the shortest time possible with the fewest number of trials. The manner in which each new series of experiments is related forms the basis of our approach. Such series of experiments can only be related to one another in two ways. There can be "paralleled" series or "crossed" series. The paralleled series method is useful only to find the best formula within a known, well defined and relatively small area (Fig. 1). It consists of preparing a number of samples along parallel lines covering the area of interest. All samples are usually prepared and tested simultaneously. From this number, the best prodt•ct is chosen on the basis of the tested per- formance of all the samples. Fig 2

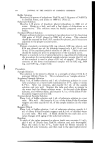
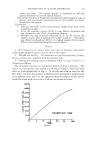
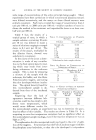
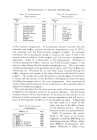
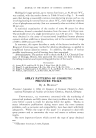
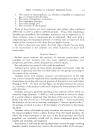
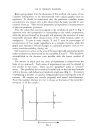
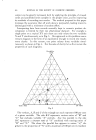
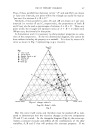
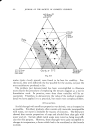
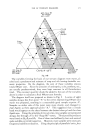
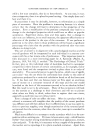
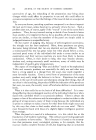
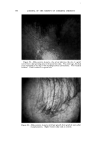
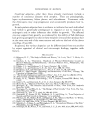
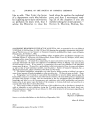
464 JOURNAL OF THE SOCIETY OF COSMETIC CHEMISTS Fig. 3 Fig. 4 A If the area of work is initially unknown as in Fig. 2, the crossed series manner of preparing formulas is the most useful. One series is prepared and tested along line A, and the best sample found to be at point 1. Using a paralleled series, it would be impossible to decide whether the next series should lie to the right or to the left of line A. If the wrong series is pre- pared, it would produce no information, resulting in a waste of time and materials. Using the crossed series method, however, a series on line B through point 1 will indicate the proper direction. Finding the best result to the right (point 2 on line B), the next logical series to try is at right angles to B through 2. Thus,-we are led into an area of best formulas for the two variables concerned. Only when the area appears su2ficiently well defined can a number of paralleled series be prepared simultaneously through it to determine the best formula. An understanding of this principle will reduce the possibility of preparing a great many useless samples. A Fig. 5 Fig. 6
Purchased for the exclusive use of nofirst nolast (unknown)
From: SCC Media Library & Resource Center (library.scconline.org)