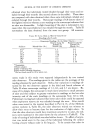
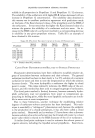
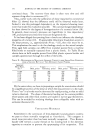
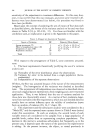
586 JOURNAL OF THE SOCIETY OF COSMETIC CHEMISTS gave no evidence of heterogeneity). The residual sum of squares was computed directly from the replicates represented by the two groups of subjects. The analysis of variance table is presented below as Table III. The significance tests (F ratios) were done as follows, guided by the ex- pressions for the expected mean squares shown in Table I: (1) The 'I'D interaction was tested against the residual and was found nonsignificant. (2) The D (times) effect was tested against the interaction mean square and found significant (99% level). The reason for this choice of error term here and for treatments is explained below. (3) The T (treatments) effect was also tested against the interaction mean square and found significant (99.9% level). The use of the residual mean square as an error term to test the signifi- cance of the interaction effect is conventional, and in this case there is little risk in concluding that the interaction, if it exists, is small. Having drawn this conclusion, it now became proper to test the main effects against either the mean square for interaction or that for the residual (13, pp. 131-132). In most cases, the use of the residual would be preferable, since it is usually based upon so many more degrees of freedom than that of the interaction that its precision is much higher. In the present case, however, there is little differentiation on this basis, since the difference in precision between an estimate of error based upon 20 degrees of freedom and one based upon 12 is quite small.* In such cases it is preferred in this laboratory to utilize the interaction mean square for error, on the basis that it is more realistic because of the terms composing it, even when the reality of the interaction variance has not been demonstrated. The two possible alternatives thus become (a) using the residual as error, or (b) pooling the residual and the interaction terms. The latter, although commonly done, results in an im- proper estimate of error if the interaction term is real and should be used with caution (13, p. 132 20). In the present case, for example, such a pooled error term would have the components (•,• q- 0.75 •2td), compared to that for the interaction (v,2 q- 2v2ta). The pooled term would there- fore inflate the significance test if o'2ta / 0. TABLE I[I--ANAL¾S•S or VARIANCE Error Significance Source of Variation DF SS MS F Term Found Among treatments (T) 3 638.33 212.78 32.63 MSta 99.9% Exposure times (D) 4 173.02 43.26 6.63 MStd 99.0% Treatments X times (TD) 12 78.25 6.52 0.35 MS•p none shown Replication (residual) 20 377.33 18.87 __ Total 39 1266.93 * For example, the tabular F value at P = 0.05 for 3/12 DF is 3.5, while that for 3/20 DF is 3.1.

EVALUATION OF ANTIPERSPIRANT DATA (I) 587 The results of the analysis of variance are shown in Table III: Having shown significance for the two main effects, it was then necessary to make individual comparisons to determine which differences among the levels of each variable were responsible for this finding. For this purpose, a Tukey test was necessary (this is a modified t test for contrasting any pair out of k means) (13, 19). The error variance estimate needed was derived from the mean square term used for error in the analysis of variance viz., 6.52. The standard deviation for error was thus the square root of 6.52, or 2.55, based upon 12 degrees of freedom. The computation of the Tukey least significant difference is similar to the computation of a least significant difference using t, but with the substitution of a new value, q, for the product (t) (W'•). When k (i.e., the number of means from which any pair is to be compared) is greater than 2, q becomes larger than (t) (W'5). In the present case: q05 for 4 means, with standard deviation estimated at 12 DF, = 4.20 q05 for 5 means, with standard deviation estimated at 12 DF, = 4.51 The least significant difference is (LSD),.• = (S•)(q.,,a)/V• (LSD),a5 = Tukey least significant difference, 95% confidence level S• = estimated standard deviation n = number of items in each mean q•5 = multiplier described above. Applying the formula, (LSD)o5 for any pair of 4 means = (2.55)(4.20)/VT6 = 3.38* (LSD)o• for any pair of 5 means = (2.55)(4.51),x/• = 4.06* The four means for treatments and the five for exposure times were computed from the data of Table II and gave the following values: Treatments (means of 10) Exposure Times (means of 10) T• = 21.33 (blank) _ T2 = 14.00 (al. chlorhydrate) _ T3 = 14.79 (experimental) _ T4 = 23.19 (sod. al. chlor. lac.) D• = 21.66 (first treatment) _ D• = 15.52 (second " ) _ D3 = 18.90 (third " ) -- D4 = 16.87 (fourth " ) -- D• -- 18.70 (fifth " ) Comparing the above least significant differences to these data, it is ap- parent (with a probability 0.05 of being incorrect), that •x T•, Tx T4 T• and T4 Ta. No other treatment contrasts can be shown to be significant. Also, Dz D2 and Dz D4 and no other exposure time con- trasts can be shown significant. This concluded the statistical examination of the data. * Note that the LSD values, as well as the means following, are expressed in coded test units (grams of perspiration X 100).
Purchased for the exclusive use of nofirst nolast (unknown)
From: SCC Media Library & Resource Center (library.scconline.org)