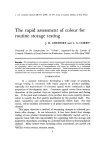
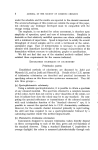
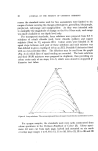
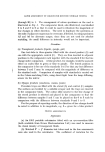
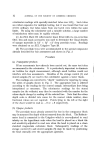
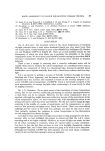
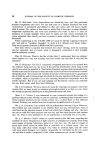
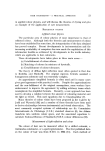
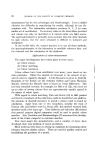
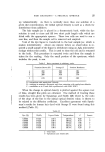
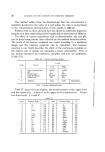
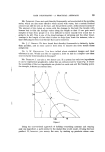
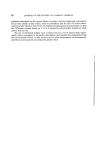
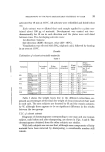
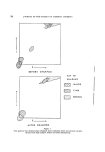
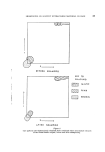
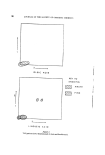
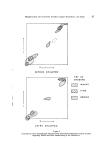
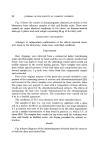
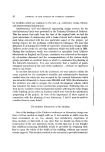
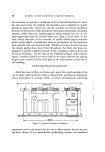
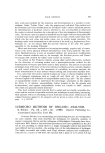
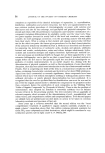
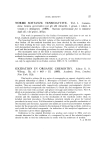
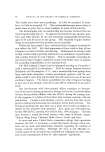
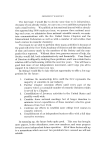
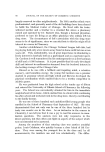
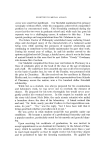
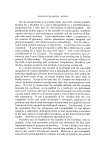
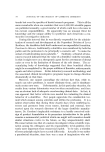
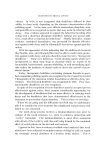
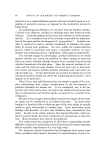
RAPID ASSESSMENT OF COLOUR FOR ROUTINE STORAGE TESTING 13 '11•, •ff l/ ? Y A / Figure 5 Graphs for "depth" change of transparent materials. The figures on the lines correspond to readings for ,control samples. 'o 1, ,/ •/' '••, Y Y ",, Figure 6 Graphs for "depth" change of opaque materials. The figures on the lines correspond to readings for control samples. Reflectometer readings may be converted to depth numbers by using Fig. 6 in the manner described for transparent products.

14 JOURNAL OF THE SOCIETY OF COSMETIC CHEMISTS DISCUSSION The measurements of colour depth have been based on a logarithmic scale as this was found to comply with visual assessments made before the instrumental technique was used. The graphs (Figs. 5 and 6) serve to define this empirical scale. They were obtained by a series of approxi- mations on actual relationships between the logarithm of the depth assess- ment and the instrumental reading for ranges of colour intensities within each of a variety of hues. The gradients of the straight lines obtained were found to be related, by a constant K, to the intensity of the sample used as a reference zero on the assessment scale. By taking the average value of K for a variety of hues, the "ideal" graphs illustrated in Figs. 5- and 6 are obtained. For simplicity, the number of lines drawn is limited to prevent over- crowding and the depth scale is divided into zones of the nearest whole number. Alternative methods for rapid conversion of instrument readings to depth numbers could be achieved with a homogram or a specially- constructed slide-rule. We have confined our range of hue standards to six, as this is regarded as a sufficiently wide choice to exemplify magnitudes of change on the hue scale. There is no reason why standards closer to actual changes should not be used if the colour range of products being tested is limited and the direction of change is known in advance. Frequently, however, two samples in the same test series change to different colours. Using the technique described in this paper, the formulation chemist is provided with an adequate indication of the stability of his product by reference to a two-dimensional colour-change determination. More precise measurement would require uneconomic expenditure of labour and equipment. If properties other than colour were not to be assessed, storage would normally be discontinued after a score of 3 had been reached on either colour scale. By this stage, the chemist should have established whether any modification of formula is necessary. Once a sufficiently stable colour has been achieved for the product, the emphasis moves from the assessment of magnitude of change to the specification of absolute limits of colour. For such purposes, of course, the conventional systems of colour measurement using precise instruments are of great value. t•EFERENCES (1) Judd, D. B. and Wyszecki, G. Colour in Business, Science and Industry 2rid edn. (1963) (Wiley, London).
Purchased for the exclusive use of nofirst nolast (unknown)
From: SCC Media Library & Resource Center (library.scconline.org)