RAPID ASSESSMENT OF COLOUR FOR ROUTINE STORAGE TESTING filter, and the chromaticity coefficients are obtained by simple calculation. For these instruments, the measurement process is relatively simple and independent of observer error, but the equipment is expensive and not economically employed for routine testing where speed is of greater importance than high precision. (c) Visual colorimeters A number of colour-matching systems depend on the visual matching of the test colour by three primary colours. In the Lovibond system, the insertion of graded-intensity red, blue and yellow glasses in front of a white standard is arranged to match the test colour under a standard source of illumination. The readings obtained from the matching filters may be converted into C.I.E. chromaticity coefficients, if required. Although such three-colour visual systems are very useful for specifying colours, they tend to be unnecessarily precise and time-consuming for storage testing. Colour standards A widely-used alternative to the three-colour systems of colour speci- fication is based on definitions of hue, intensity or saturation, and tone or lightness (1,3). Hue is the name used to describe the colour, such as yellow, red, green or blue. Intensity or saturation represents the state of dilution of a pure colour with white light, illustrated by the decrease in intensity from purple to lilac. Tone or lightness is governed by the admixture of grey or black with the colour, or by the intensity of illumi- nation of the colour. These systems are not incompatible with the C.I.E. system, but have the fundamental difference that the basic colour or hue is defined by a name, rather than by figures. Hence one of our basic requirements, ease of interpretation, is met by these systems since all chemists will be familiar with the hue names but would require special training to interpret nume- rical descriptions. Hue changes may be assessed quite rapidly by com- parison with a standard graded colour-scale, as long as the gradations are not too close. Visual assessments of colour are complicated by the saturation and tone scales. A change in tone may appear to change the hue, as exemplified by the transition from yellow to olive-green, merely by increasing the proportion of neutral grey. Also, due to the wide acceptance of brown as a distinct "colour," a tone change from orange to brown may be incorrectly

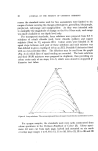
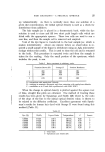
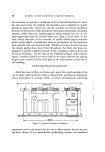
JOURNAL OF THE SOCIETY OF COSMETIC CHEMISTS assessed as a hue change. Further, in the intermediate tone ranges, i.e. the greyish colours, it is very difficult to distinguish between small tone or saturation changes. These uncertainties cause delays in visual colour assessment and render it unsuitable for rapid testing. Similarly, the same ambiguities make the interpretation of the results more difficult for the chemist. For these reasons, the saturation and tone scales have been combined in our technique to produce a simple two-dimensional colour system. TWO-DIMENSIONAL COLORIMETRY FOR STORAGE TESTING Two fundamentally different procedures were adopted for the assess- ment of "colour hue" and "colour depth." The latter is a combination of the saturation and tone dimensions discussed above. Preliminary experiments showed that subjective assessments of both hue and depth were susceptible to the same confusion as occurred with hue, saturation and tone assessments. It was therefore decided to measure depth photometrically so that observers could confine their attention to hue assessment while ignoring changes in saturation or tone. Photometric measurement of depth was achieved by measuring the light absorption of the colour by a photocell which, in combination with an eye-correction filter, has the same sensitivity as the eye throughout the spectrum. This instrument gives an integrated measure of saturation and tone as apparent to the eye. Hue changes were assessed visually by comparison with suitable standards. To conform with other storage tests carried out by the same observers, a scale of 0 to 5 was to be used for reporting colour changes. The scale is illustrated in Table I. Table I Scale of change on storage Score Degree of change from control 0 None 1 Barely perceptible 2 Slight, but definite 3 Moderate 4 Large 5 Extreme It must be emphasized that this scale is not absolute, but the degree of change from a control sample consisting of unchanged product. The
Purchased for the exclusive use of nofirst nolast (unknown)
From: SCC Media Library & Resource Center (library.scconline.org)