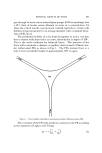
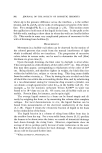
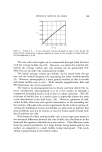
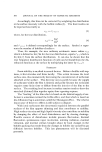
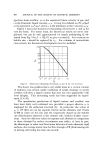
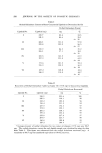
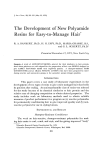
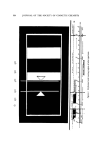
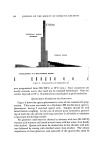
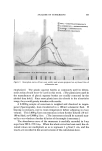
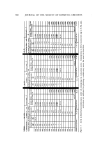
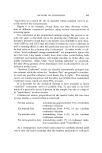
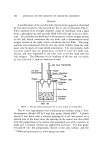
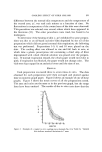
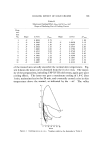
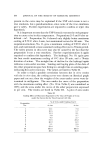
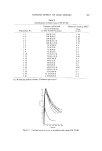
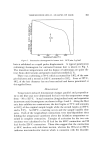
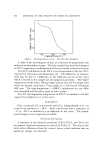
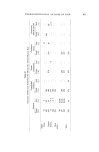
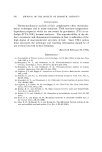
$02 JOURNAL OF THE SOCIETY OF COSMETIC CHEMISTS where ap is the pressure difference across the interface, •, is the surface tension, and R• and R2 are the radii of orthogonal curvatures of the inter- face. For a straight PB, R2: •o, so that ap -- -,//R•. This suction causes the capillaries to hold most of the liquid in the foam. It also pulls at the bubble walls, tending to draw them in where the walls are locally thicker (5). This results in some very complicated patterns of movement in the walls of draining foam bubbles (6). MEASUREMENT Movement in. a bubble wall often can be observed by the motion of the colored patterns that result from the mutual interference of light which is reflected off the two interfaces. The progression of successive colors, taken in reverse order, can be used to determine the wall (film) thickness at a given time (5). Upon thorough draining, the final color by daylight is silver-white. This corresponds to a film thickness of the order of 10 -5 cm. Bits of black film may then appear, corresponding to thicknesses of the order of 10 -6 cm. Being thinner, and therefore lighter in weight, the black film rises within the bubble face, subject to viscous drag. This drag stems chiefly from the surface viscosity, vs. Thus, by timing the rate at which such bits of black film rise within the surrounding thicker film, and by substituting in a two-dimensional analog for transverse drag around a cylinder, one can obtain a rough quantitative value for v8 in the bubble wall (5). For example, v8 for the nonionic surfactant Triton X-100 ©* in water was found to be 10 -4 dyne sec/cm (6). Of course, not all bubble walls are so mobile. Protein films, for instance, can be quite rigid. The average liquid content in a foam can be found simply and di- rectly by weighing the foam, or by measuring the volume after complete collapse. For local determinations in situ, the liquid fraction can be found from measurements of the electrical conductivity of the foam (3, 7-10). Figure 2 relates the volumetric fraction of liquid in the foam to the conductivity of the foam. The liquid fraction in a column of rising foam differs from that in the overflow from the top. For a very stable foam, theory (9, 11) predicts the former to be about twice the latter, as a result of interstitial drainage back down through the rising foam. However, experiments show an average of thrice, perhaps partly because of some coalescence at the over- flow bend which then increases the back drainage. The aforementioned theory will be discussed further later. * Rohm and Haas Co., Philadelphia, Pa.

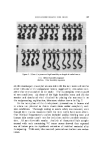
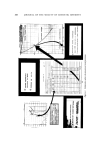
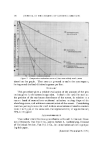
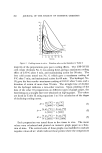
PHYSICAL ASPECTS OF FOAM 303 I-X 0.20 0.16 0.12 0.08 0.04 / 0 0.02 0.04 0.06 0.08 0.10 Kf/K• Figure 2. A plot of (1 -- X), the volumetric fraction of liquid in foam, versus Kt/K •, the ratio of foam conductivity to liquid conductivity, based on the average of results from sev- eral investigations (3, 8-10) The ease with which light can be transmitted through foam increases with the average bubble size (12). However, as a means for actually esti- mating the average bubble size, this method can be questioned (lg). Other factors also affect the transmissivity of light. The initial average volume per bubble can be found from the gas rate and the bubble frequency by measuring the latter stroboscopically (6). However, photography is a more general method in that it records individual bubble sizes as well. With suitable magnification, film and PB dimensions also can be measured. The foam to be photographed can be frozen and then sliced (14), or, more conveniently, photogTaphed as is at a free surface or through a transparent bounding surface such as that of a glass container. The dis- tribution of bubble sizes in a surface layer is reportedly almost the same as the distribution in the bulk foam (14). However, questions of indi- vidual bubble distortion and optical uncertainties at the bounding sur- face remain, although some recent experiments by the author's group in- volving the building of a foam one bubble at a time seem to indicate that these problems may not be serious, at least for foams made of large bub- bles of uniform size (10). With foams of widely varying bubble size, a more important matter is the statistical difference between the true bubble size distribution in the foam and the apparent distribution at any surface. This difference stems from the greater probability of a large bubble being intercepted by the surface, as compared to a small bubble being intercepted. The prob- ability is proportional to the bubble radius.
Purchased for the exclusive use of nofirst nolast (unknown)
From: SCC Media Library & Resource Center (library.scconline.org)