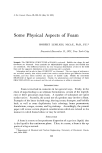
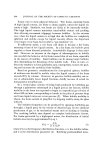
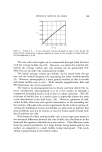
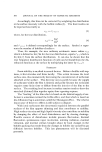
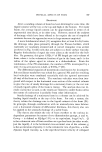
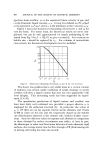
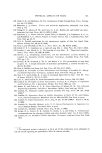
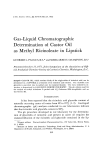
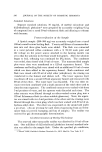
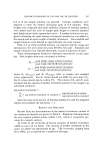
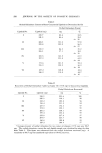
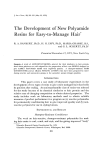
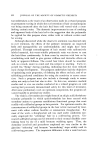
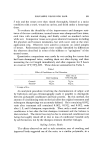
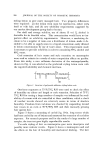
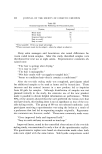
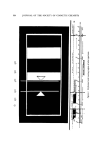
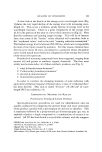
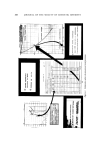
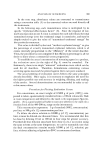
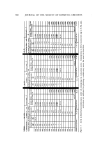
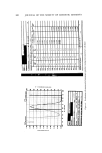
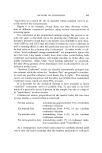
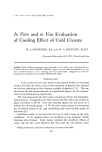
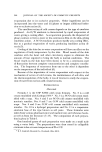
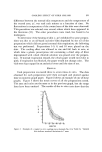
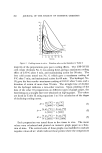
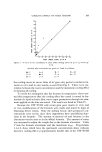
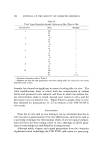
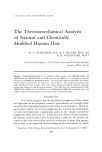
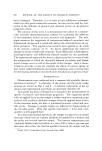
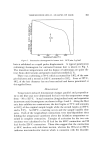
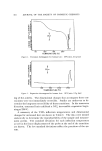
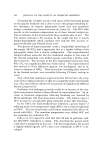
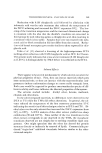
364 JOURNAL OF THE SOCIETY OF COSMETIC CHEMISTS •- 25,• -- o w I I I I 50 I00 150 200 TEMPERATURE (øC) Figure 4. Extension thermogram for human hair: 20øC/min, 2.3-g load I I 1 I00 150 200 TEMPERATURE (*C) ! 25O Figure 5. Expansion thermogram for human hair: 20øC/min, 2.3-g load ing of the o•-helix. The dimensional changes that accompany these con- tractions were not immediately reversible. Studies are underway to de- termine the long-term reversibility of these transitions. In the transverse direction, untreated hair exhibited a 54% irreversible expansion begin- ning at 256øC. A summary of the TMA inflection temperatures and dimensional changes for untreated hair are shown in Table I. The data were treated statistically to determine the reproducibility of the sample and measure- ment system. The standard deviation for each inflection temperature as well as the linear displacement of the probe at the end of the transition are shown. The low standard deviations reflect the precision of the sys- tem.

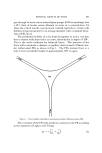
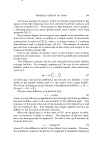
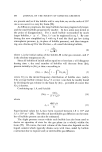
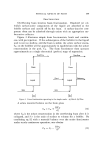
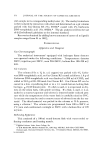
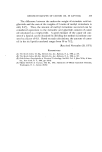
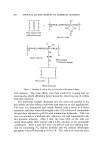
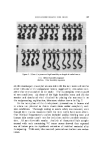
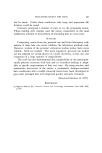
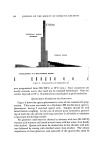
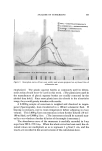
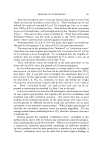
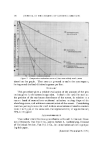
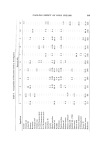
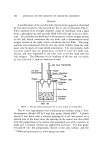
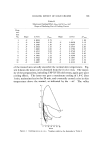
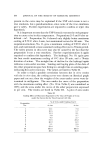
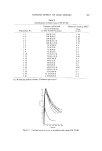
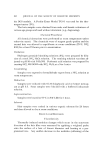
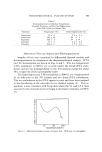
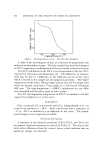
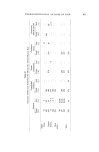
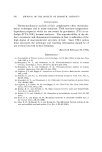
THERMOMECHANICAL ANALYSIS OF HAIR Table I Relationship between Inflection Temperature, Standard Deviation, and Per Cent Displacement of the TMA Probe for Human Hair 365 Transition Temperature (øC) Probe Displacement (%) Penetration 59 zk 6 3.0 4- 0.4 Penetration 242 q- 10 24 4- 4 Expansion 256 4- 3 54 q- 19 Extension 72 4- 6 0.6 4- 0.2 Extension 224 q- 6 2.9 4- 0.4 Differential Thermal Analysis and Thermogravimetry Samples of hair were examined by differential thermal analysis and thermogravimetry to complement the thermomechanical analysis. DTA and TG thermogTams are shown in Figs. 6 and 7. The low-temperature TMA transitions (100øC) are covered under the broad DTA endo- therm and are not distinguishable in the TG analysis except for about 10% weight loss which is presumably water. The high-temperature TMA transitions (200øC) are complemented by an inflection in the TG analysis and two sharp DTA endotherms. The two endotherms in the DTA appear in wool and have been assigned to the disordering of the a-keratin in two distinct regions (4). This as- signment is also consistent with X-ray data where the 5.1 and 1.8 A lines associated with a-keratin structure begin to decrease in intensity at 210øC (5). o x i i I 50 150 :50 TEMPERATURE (øC) Figure 6. Differen. tial thermal analysis of human hair: 20øC/min, Ns atmosphere
Purchased for the exclusive use of nofirst nolast (unknown)
From: SCC Media Library & Resource Center (library.scconline.org)