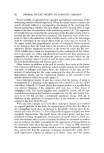
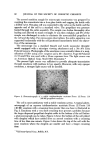
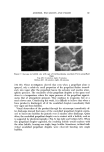
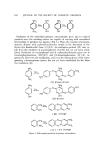
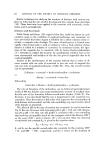
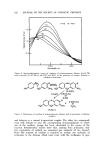
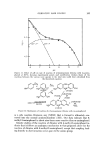
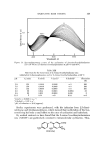
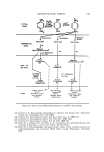
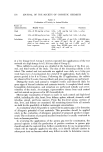
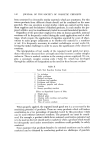
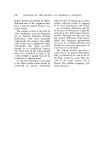
AEROSOL EMULSIONS AND FOAMS 93 Figure 3. Photomicrographs of an unstable triethanolamine myristate/Freon 12/Freon 114 (40/60) propellant emulsion Left. Bottom of cell plated with large droplets Right. Top of cell showing small droplets After the emulsion had been photographed in the cell, the product was dis- charged onto a microscope slide in order to photograph the foam. A cover glass was placed on the foam which was illuminated from the top. It has been reported that a cover glass can cause distortion of the foam bubbles (17). In the present work, it was found that a cover glass was necessary to obtain satis- factory photomicrographs of the foams. The cover glass was placed on the foam as lightly as possible to minimize distortion. The droplet sizes of the emulsified propellant droplets and the diameters of the foam bubbles were estimated using a scale prepared by photographing a stage micrometer at the same magnification as that used for the emulsions and foams. The scale was calibrated in intervals of 10/•. Diameters down to about 2/• could be estimated and droplets with diameters less than 2/z could be detected but not measured with any degree of accuracy. Edmundson (18) has reported that the smallest diameter of a particle that can be measured microscopically with any precision lies in the range of 1-9./•. Augsburger and Shangraw have reported a method for bubble size analysis based upon photo- micrographs of aerosol foams (2). In order to obtain an indication of the range of the diameters of the emul- sion droplets and foam bubbles, the field under the microscope was scanned until the largest droplet or bubble was observed. This portion of the field was then photographed. The diameters of the largest droplets and bubbles were measured, and those of the smallest were estimated. It must be emphasized that the range between the smallest and largest diameters has no particular relationship to the average droplet or bubble size.

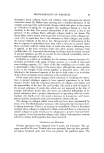
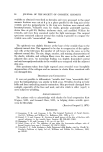
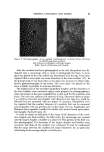
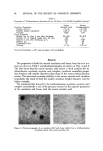
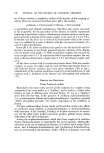
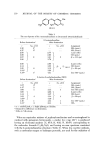
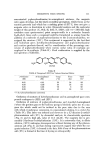
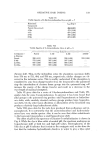
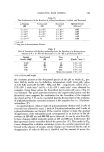
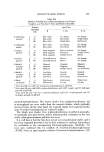
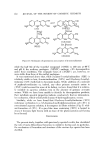
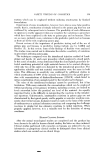
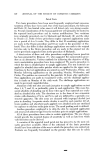
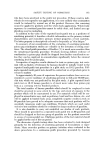
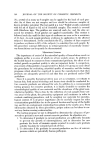
94 JOURNAL OF THE SOCIETY OF COSMETIC CHEMISTS Table I Properties of Triethanolamine Myristate/Freon lg/Freon 114 (40/60) Propellant Systems a Emulsion Properties Droplet size (t•) Stability (phase separation) Viscosity Foam Properties Bubble size (t•) after I min after discharge 20-160 Stability (% of original height after 60 min) 100 Density (1 min after discharge, g/cc 0.45 Stiffness (g) 72 % drainage (1 hr) 0 Wetting 1 hr Excess Excess Myristic Acid Triethano]amine 2--30 2--100 24 hr 1 rain High Low 20--210 0 0.49 20 81 30 sec aAerosol formulation ---- 90% aqueous phase-10% propellant. POgSULTS The properties of both the aerosol emulsions and foams from the two sys- tems are given in Table I and photomicrographs are shown in Figs. 4 and 5. The data show that the excess myristic acid system (which contains the tri- ethanolamine myristate-myristic acid complex) produces emulsified propel- lant droplets with smaller diameters than those in the excess triethanolamine system. The increased creaming stability in the excess myristic acid emulsion is probably the resttit of both the smaller emulsion droplet diameter and the higher viscosity. The interfacial film formed by the triethanolamine myristate-myristic acid complex undoubtedly is one of the primary reasons for the superior properties of the emulsions and foams with the excess myristic acid. Figure 4. Photomicrographs of an emulsion (left) and foam (right) from a triethanolamine mryistate system with excess myristic acid
Purchased for the exclusive use of nofirst nolast (unknown)
From: SCC Media Library & Resource Center (library.scconline.org)