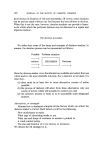
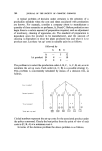
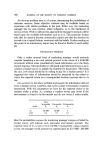
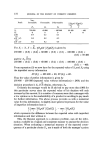
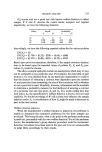
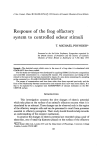
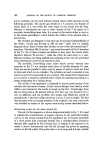
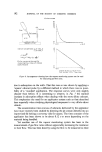
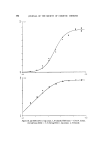
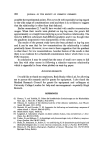
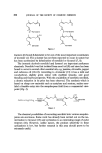
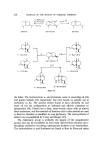
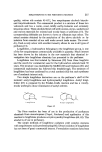
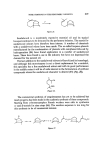
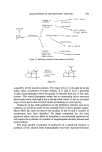
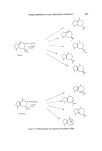
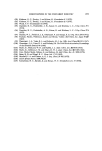
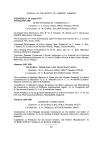
184 JOURNAL OF THE SOCIETY OF COSMETIC CHEMISTS mucosa, and the other larger one on inactive tissue. The plotted time course of the potential is called the ElectroOlfactoGram or EOG. Fig. 1 illustrates a typical EOG resulting from a 5-s stimulus of 1,8 Cineole. half seconds I I I I I I Figure 1. EOG resulting from a 5-s stimulus of 1,8 Cineole. EOG's wero first recorded by Hosoya and Yashida in 1937 (1). They were not systematically studied until nearly 20 years later. In 1956 Ottoson published his classic Analysis of the electrical activity of the olfactory epithelium (2). This was a lengthy and thorough investigation of EOG's in frogs. In it much attention was paid to the relationship of EOG size and shape to strength, duration and quality of the stimulus used. The conclusions of Ottoson's research remain practically unchanged today. This is a re- markable tribute considering the relatively simple apparatus which he had at his disposal. It has been an object of the present research to look again and more closely at some of the factors investigated by Ottoson, taking advantage of modern instruments and technology to control and define as precisely as possible the chemical composition, concentration and time course of the stimuli used at the location where it matters--close to the olfactory epi- thelium. Apparatus has now been evolved to meet these requirements (3) to a large degree. A feature of the stimulus applicator is that it can handle up to six different odour streams switching them on and off independently of each other and so close to the point of discharge that practically no time is

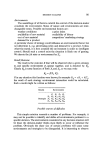
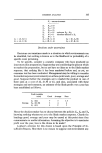
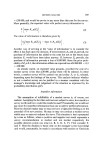
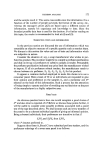
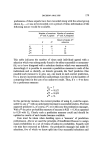
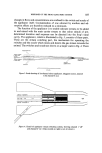
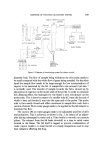
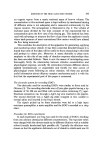
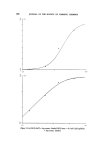
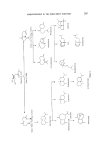
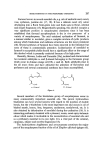
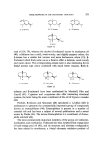
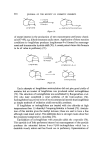
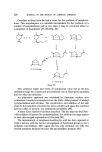
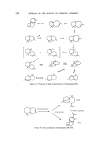
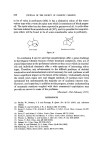
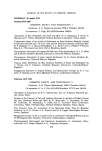
RESPONSE OF THE FROG OLFACTORY SYSTEM 185 needed for a steady state to be reached. The apparatus may therefore be used for experiments which have not, it seems, been possible before. One of its first uses has been in the investigation of the relationship between stimulus concentration and the amplitude of the resulting EOG. METHODS The animals and their preparation Common frogs (Rana temporaria) were used for the EOG recordings. A frog was first anaesthetized by placing it in 15 ml of 10• aqueous urethane in a beaker. As soon as the frog lost its reflexes, it was rinsed with water and placed in a holder. The frog remained anaesthetized by this treatment for the whole course of the experiment and it was not allowed to recover. The olfactory epithelium was exposed by dissecting away the dorsal wall of the nasal cavity opposite to the eminentia olfactoria. The opening thus made was 2-3 mm across and provided access for the recording electrode and the stream of air carrying the stimulus. The stimulation system The stimulation system may best be described by reference to Fig. 2. It consists of a constant stream of clean moist air which plays on the olfactory epithelium all the time. This prevents the mucus from drying up, prevents Flow Rotary regulator flowmeter Carrier (100mMmln) pressure Pressure Flow L ............ Water/ice bath Regulators gauges RestrictorS Odorant tubes Figure 2. Diagram of the arrangement of odorant streams.
Purchased for the exclusive use of nofirst nolast (unknown)
From: SCC Media Library & Resource Center (library.scconline.org)