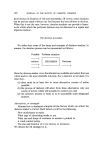
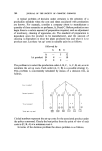
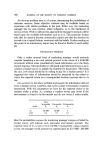
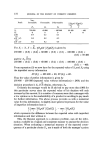
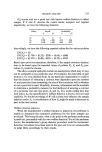
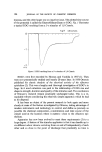
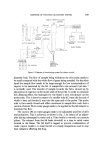
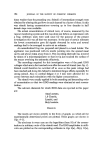
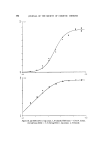
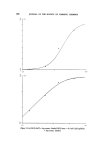
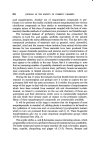
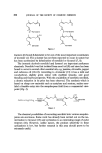
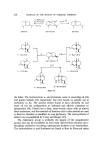
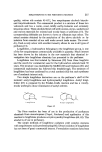
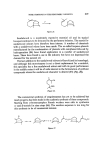
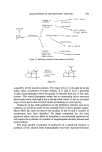
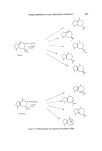
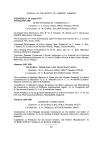
192 JOURNAL OF THE SOCIETY OF COSMETIC CHEMISTS Elution curves o Air Fido •, I oe ml/min -'"--z-•_•¾ Foil cover,• •-' Mogne ? stirrer--'-] ß o,o -14.0 Odoront concentration ½o at time• ½ at time, C=COE, V Loglo c = JOglO c O- •V t ElutJon curves can be used for measuring flow rotes with minimal back pressure 0 ß 0.0, -14 0 Cineole elution curve 13-3.72 Fido current (PA)v Time (rain) Figure 8. Arrangement showing how the vapour monitoring system can be used for measuring gas flow rates. due to adsorption on the walls. That this was so was shown by applying a 'square' odorant pulse by a different method in which there was no possi- bility of a 'rounded' application. The response curves were only slightly sharper than before. It is interesting to observe, in Fig. 7 the marked increase in adsorption effects when dealing with the more dilute odorant. This emphasizes the need for an applicator system such as that described here especially when studying physiological responses to very dilute odour stimuli. The concentration time courses of odorants delivered by the applicator have more recently been studied by directing the jet stream directly into an improvised fid having a cut-away side for access. The time constant of the applicator has been shown to be about 0.12 s or more depending on the material being handled. Yet another use of the vapour monitoring system has been in the measurement of gas flow rates without appreciably increasing the resistance to their flow. This has been done by using the flow to be measured to elute

RESPONSE OF THE FROG OLFACTORY SYSTEM 193 an organic vapour from a nearly enclosed space of known volume. The concentration in this enclosed space is kept uniform by mechanical mixing (if diffusion alone is not adequate) and is measured continuously by the vapour monitor. The arrangement is illustrated in Fig. 8. The volume of enclosed space divided by the time constant of the exponential fall in concentration gives the flow rate of the eluting gas. This method has been used with advantage to measure the flow of gas from the applicator nozzle where back-pressure of most conventional flow meters would have altered the flow being measured. This concludes the description of the apparatus for generating, applying and monitoring odour stimuli. It has been somewhat detailed because it is hoped that some of the ideas will be useful to those researching in this field and perhaps to others also. Moreover it seems desirable to place more emphasis on this side of any study of stimulus-response relationships than has been accorded hitherto. There is now the means of investigating more thoroughly firstly the relationship between stimulus concentration and physiological response, secondly the interactions between different odours applied simultaneously or sequentially and thirdly the time course of physiological events following an odour stimulus. All these can provide useful information about olfactory receptor mechanisms and it is with the first that the experimental part of this paper is concerned. The electrode system for recording EOG's The electrodes used for recording EOG's were similar to those used by Ottoson (3). The recording electrode was a Pyrex glass pipette having a tip diameter of 50-100 gm and filled with normal saline containing 2• agar. Electrical connection was through a AgC1-Ag wire inserted in the pipette. The second electrode was a AgC1-Ag plate wrapped in lint, soaked in normal saline and inserted in the frog's mouth. The signals picked up by these electrodes were led to a high input resistance preamplifier, a main amplifier and the EOG's recorded on a strip chart. Procedure for EOG experiments In each experiment one frog was used for the study of EOG's resulting from one odorant chemical at different concentrations. The vaporizer tubes were charged with the odorant made up to different dilutions with a suitable solvent (usually deodorized light paraffin oil). Typically the dilutions were chosen so that the applicator delivered a set of stimuli in which each was 10
Purchased for the exclusive use of nofirst nolast (unknown)
From: SCC Media Library & Resource Center (library.scconline.org)