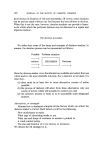
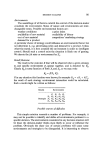
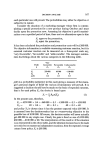
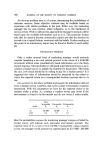
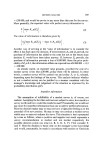
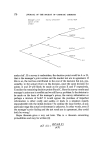
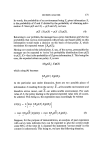
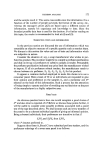
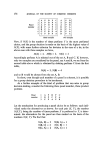
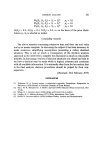
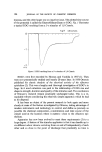
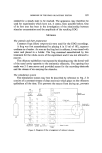
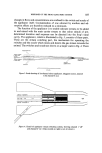
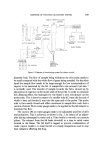
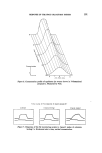
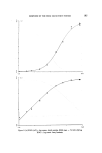
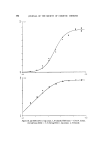
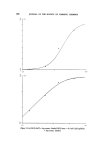
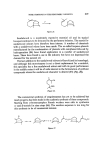
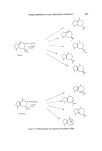
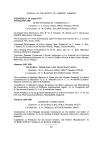
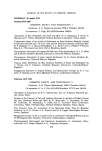
190 JOURNAL OF THE SOCIETY OF COSMETIC CHEMISTS The vapour monitoring system has been used mainly for determining the concentration of odour stimuli delivered by the applicator. Its fast response facilitates the adjustment of the odorant streams so that the desired concentrations are delivered. Once the odorant solutions and flow rates have been adjusted, it is unnecessary always to check the concentrations during a series of olfactory response measurements but only before and after the series. Only when solutions of very volatile substances are used is there any change noticeable in the composition over the period of an experiment. The vapour monitoring system has other important uses. One of these, as mentioned above, was to check the mixing of odorant and carrier streams in the applicator jet. This was done by moving the probe tip 0.2 mm at a time across the 1-mm diameter of the jet orifice with an odorant switched on. The concentration profile so obtained was asymmetrical when mixing was not complete. Incidentally this experiment demonstrated that the sampling system was capable of discerning differences between points only 0.2 mm apart. When the concentration profiles are determined for diameters pro- gressively further and further away from the jet, a three-dimensional picture may be built up showing concentration on the vertical scale and displacement from the jet axis on the horizontal scale. Such a diagram is shown in Fig. 6. This may be the first time that an odorant jet stream has been mapped in this way and it is interesting to note that the concentration has fallen to half its original at a distance 12 mm from the orifice due to the spreading sideways of the odorant. Obviously the positioning of the applicator jet relative to the nasal cavity is of considerable importance. It would be useful to know also how the humidity of the jet streammoriginally saturated--falls off for the same reasons. The olfactory mucus does some- times become dry in spite of the precaution of saturating the carrier gas with water vapour. Another use of the vapour monitoring system has been to check the efficiency of the applicator switching and to obtain some idea of the time course of build-up and fall-off of concentration when an odorant is switched on and off. It was found that, even with much smaller carrier gas flow and increased odorant stream flows, the device reliably and completely switched on and off. Fig. 7 shows the three fid response curves to 2-s applications of acetone, cineole (strong) and cineole 1 000 times more dilute. Ideally the traces should be rectangular. The rounding of the shoulders is due largely to the slow movement of sample up the probe tube

RESPONSE OF THE FROG OLFACTORY SYSTEM 191 Concentration 2 I O I 2 mm from axis Figure 6. Concentration profile of applicator jet stream shown in 3-dimensional perspective. Measured by Fido. Time course of Fido responce to s•uare pulses of- Acetone Cineole (strong) C[neole (weak) Figure 7. Response of the fid monitoring system to 'square' pulses of odorants lasting 2 s. Horizontal axis is time, vertical concentration.
Purchased for the exclusive use of nofirst nolast (unknown)
From: SCC Media Library & Resource Center (library.scconline.org)