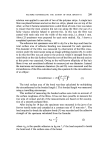
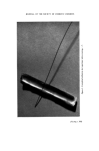
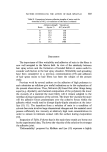
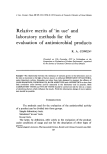
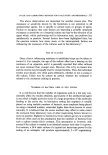
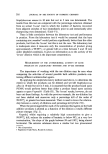
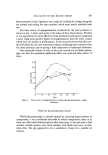
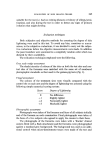
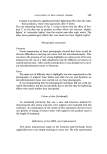
FACTORS CONTROLLING THE ACTION OF HAIR SPRAYS-II 299 solution was applied to one side of two of the polymer strips. A single hair fibre was placed between and across the two strips, placed one on top of the other, so that it became cemented into a solid block of resin. Care was taken to ensure that the resin solution did not run along the fibre the use of a fairly viscous solution helped to prevent this. In this way the fibre was coated with resin only over the width of the resin strip, i.e. about 1 mm. About 25 specimens were prepared for each resin studied. Fig. 1 shows a completed specimen before testing. The adhesion test specimens were left to dry for a few days and then the total surface area of adhesive bonding was measured for each specimen. The diameter of the fibre was measured by observation of the fibre cross- section under the microscope using an image splitting eyepiece (8). In order to do this the fibre was cut close to the point at which it emerged from the resin block on the side furthest from the root of the fibre and the end section at this point was examined. Owing to the well-known ellipticity of the hair fibres it was not considered sufficient to measure just one diameter. Instead the maximum and minimum diameters (2a and 2b) were measured and the circumference of the fibre calculated using the equation for the circumference of an ellipse: Circumference = 2n ( a• + b•'• «' (1) The total surface area of the bond was then calculated by multiplying the circumference by the bonded length I. This bonded length was measured using a travelling microscope. This method of measuring the bonded surface area took no account of the surface roughness of the fibres. It has not been possible to measure the true area of contact and all of the measurements are based on the assump- tion of a smooth-surfaced fibre. After drying for 14 days the specimens were mounted in the jaws of an Instron tensile tester and extended at a constant rate of 15 mm min 4. The load required to break the adhesive bond (F) was recorded and the adhesive strength of the specimen calculated from the formula: F Gad -- (2) S where IJad is the specific adhesion in kg cm -•', F the load required to break the bond and $ the surface area of the bond.

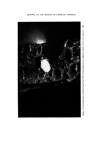
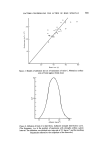
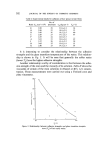
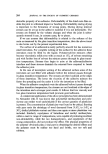
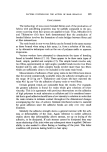
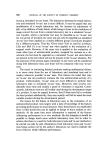
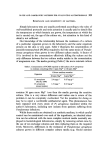
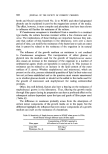
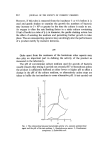
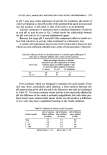
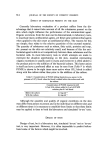
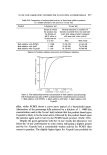
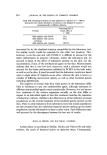
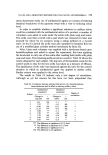
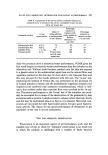
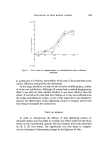
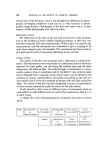
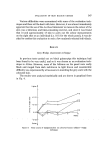
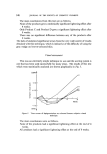
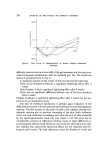
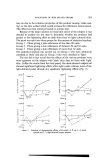
300 JOURNAL OF THE SOCIETY OF COSMETIC CHEMISTS When testing the specimens the fibre was always pulled in the same direction that is, the root end of the hair fibre was held in the lower pair of jaws and the resin in the other pair. In this way the motion of the fibre was with, and not against, the cuticle cells. This corresponds to the action of combing or brushing the resin out of the hair, when the resin is pulled away from the hair fibre by the comb moving towards the tip of the fibre. On examining the specimens under the microscope after testing, a hole was usually clearly visible in the resin block where the fibre had been cemented (see Fig. 2) and no resin was left adhering to the fibre. This showed that the breaks were adhesive in nature. Through all the tests a consistent behaviour was observed. In each case the specimens either broke down by adhesive failure at the resin-fibre interface or the adhesion was so great that the bond remained stable up to loads at which fibre breakage occurred. This latter behaviour was observed in a few cases where thin fibres and large bond lengths were encountered, but no examples of resin material fracture itself were observed. This is consistent with the observations of Hearle and Newton (3) on model systems of bonded fibres in their investigations on nonwoven fabrics. RESULTS The value of adhesive strength for a particular resin was determined by taking the arithmetic mean of about 25 specimens. Fig. 3 shows a typical set of results for hair spray resin C plotted as surface area of bonding against specimen break load. Although there is scatter in the results, as with all adhesion measurements, the correlation between surface area and break load can be clearly seen. The larger the bonded surface area the greater the break load of the specimen. Fig. 4 shows the same data plotted as a distribution curve of adhesive bond strength against frequency. The frequency, A•n, is the number of specimens with strengths within a given interval. The specific adhesion was divided into intervals of 2.5 kg cm -• and the resulting frequencies referred to the midpoints of the intervals. Several commercially available hair spray resins were studied by the above method. Table I lists the adhesive strengths of these resins together with the number of specimens used in each case, and the average total surface area of the bonds, S. The final column of Table I lists the glass transition temperatures (Tg) for each of the resins.
Purchased for the exclusive use of nofirst nolast (unknown)
From: SCC Media Library & Resource Center (library.scconline.org)