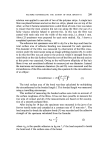
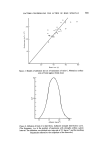
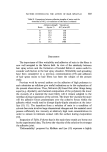
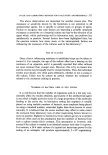
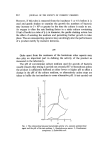
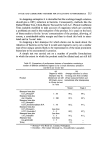
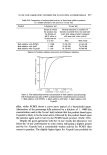
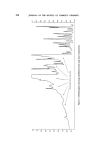
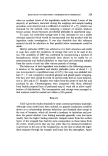
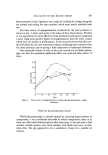
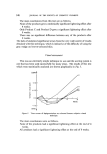
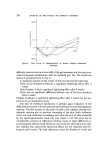
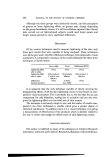
FACTORS CONTROLLING THE ACTION OF HAIR SPRAYS-II 301 3.0 o o • o o o Oøoø o ø • •øo - øc• E• oe.0 1.0 I I •0 40 60 80 Bre•k Io•cl (g) Figure 3. Results of adhesion test on 27 specimens of resin C. Plotted as surface area of bond against break load. I0 15 20 25 Adhesion (kg crrF 2) Figure 4. Adhesion of resin C to hair fibres. Adhesive strength distribution curve. (The frequency, An, is the number of specimens with strengths within a given interval. The adhesion was divided into intervals of 2.5 kg cm -2 and the resulting frequencies referred to the midpoints of the intervals.)

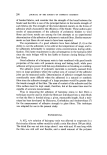
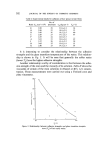
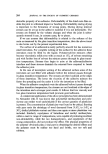
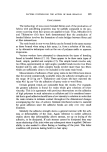
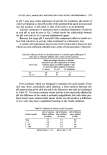
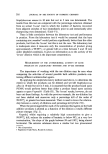
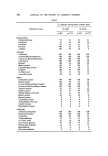
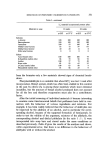
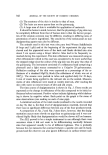
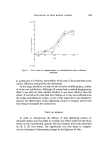
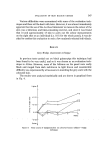
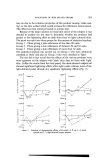
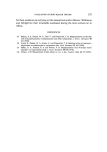
302 JOURNAL OF THE SOCIETY OF COSMETIC CHEMISTS Table I. Experimental results for adhesion of hair sprays to hair fibres No. of Resin Sav (cm2x 10 a) specimens C•ad (kg cm -2) Tg (øC) E 2.88 29 21.84-3.3 24 H 2.88 22 18.94-2.9 32 D 2.88 26 18.54-2.5 40 C 2.68 27 17.14-2.5 47 F 2.85 24 16.84-3.3 -- A 3.01 21 16.64-3.6 42 i 2.57 28 15.44-2.2 59 B 3.05 25 15.04-1.9 51 G 2.80 27 14.54-2.7 34 It is interesting to consider the relationship between the adhesive strengths and the glass transition temperatures of the resins. This relation- ship is shown in Fig. 5. It will be seen that generally the softer resins (lower Tg) have the higher adhesive strengths. Another relationship worthy of consideration is that between the adhe- sive strength of the resin and the viscosity of its solution. Table H shows the viscosities of certain of the resin solutions in ethanol at 40•o w/w concen- tration. These measurements were carried out using a Ferranti cone and plate viscometer. 20- 14 I I I 20 4O 6O rg (øc) Figure 5. Relationship between adhesive strengths and glass transition tempera- tures (Tg) of hair spray resins. 22-
Purchased for the exclusive use of nofirst nolast (unknown)
From: SCC Media Library & Resource Center (library.scconline.org)