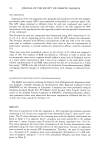
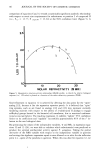
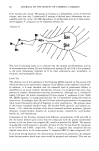
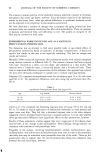
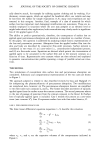
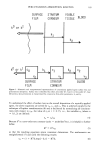
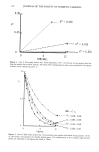
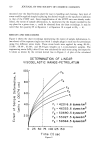
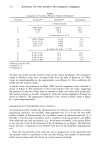
108 JOURNAL OF THE SOCIETY OF COSMETIC CHEMISTS 3. The physical significance assigned to k 2 is movement from the stratum corneum to the systemic circulation. The primary transport resistance associated with this step is most likely to be diffusion through the viable tissue of the epidermis and upper dermis. Diffusion coefficients and transport path lengths for this movement have been identified (7,10) and have been shown to be relatively insensitive to molecular size. A simple calculation shows that a k 2 assignment of 1.800 hr-• is a reasonable average and is justified by experimental and interpretive work (7,10). This k 2 value has been used exclusively, therefore, in the concentration-time profile calculations. CASE I: ZERO-ORDER SURFACE LOSS Using the rate constants in the upper half of Table I, and equations 6 and 7, concen- tration-time profiles for u0 and u•, respectively, may be generated. The calculations for u• assume v0 -- v•, which is a reasonable and convenient, though not necessary, assumption. The profiles for each combination of K ø, k• and k 2 (see Table I) are given in Figures 2 (u0) and 3 (u•). 1,0 u 0 0,5 CASE, K ¸, K1 IA, 0,001, 0,036 IC, U,010, 0,036 X' .................. IE, 0,050, 0,036 • lB, 0,001, 0 180 "..... '•], .... ID, 0,010, 0,1•0 'r- ................ i ....................... IF U,050, 0,180 0 6 12 TIME/HRS, Figure 2. Case I: Zero-order surface loss. Concentration-time profiles (calculated using equation 6) for u0, the surface concentration of topically appl!ed agent. The combinations of rate constants used for each profile are identified in the figure and listed in Table I.

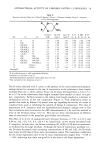
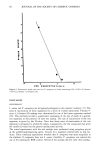
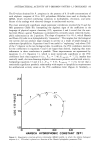
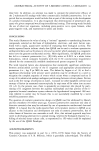
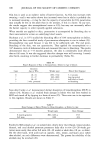
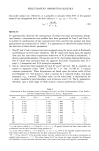
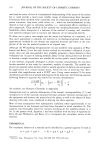
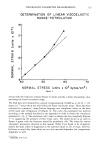
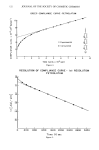
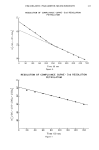
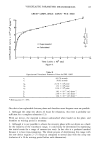
PERCUTANEOUS ABSORPTION KINETICS 109 0,08 u 1 0,04 CASE, K ø, K 1 IB, 0,001, 0,180 ID, 0.010, 0,180 • .................... IF, 0,050, U,180 IA, 0. 001, 0. 036 '.• Ic, 0.010, 0.036 '•')(" ................ X • .............. IE, 0,050, 0,036 0 6 12 TIME/HRS, Figure 3. Case II: Zero-order surface loss. Concentration-time profiles (calculated using equation 7) for u•, the stratum corneum concentration of agent. The combinations of rate constants used for each profile are identified in the figure and listed in Table I. It is also instructive to assess the fraction (F ø) of the applied dose lost from the surface due to the K ø process. For zero-order surface loss, this fraction is given simply by equation 17. F ø= Køt (17) That is, F ø increases linearly with time so long as material is present on the surface. This result is, of course, directly deduced by integrating equation 1, ignoring the second term on the right-hand side of the expression. F ø as a function of time for the three K ø values considered is shown in Figure 4. In Table I, for each of the Case I situations, the value of to (corresponding to Uo = 0) is given. CASE II: FIRST-ORDER SURFACE LOSS Profiles for Uo and u• in this case are obtained by substituting the rate constants in the lower half of Table I into equations 13 (Uo) and 14 (Ul). The results for the various permutations of k I, kl, and k 2 (IIa-IId see Table I) are presented in Figures 5 and 6 for Uo and u•, respectively.
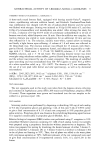
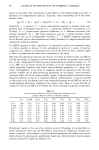
Purchased for the exclusive use of nofirst nolast (unknown)
From: SCC Media Library & Resource Center (library.scconline.org)