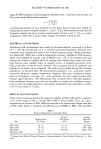
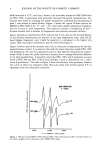
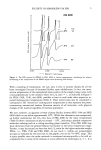
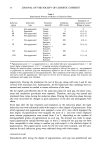
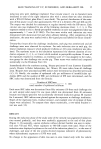
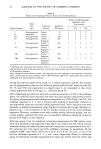
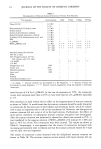
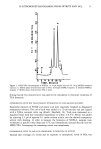
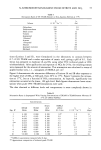
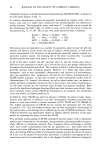
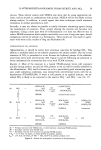
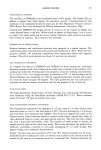
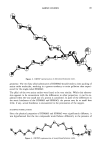
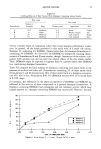
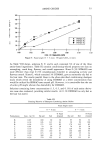
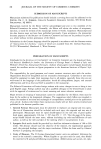
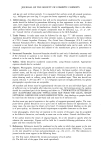
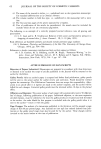
FLUIDITY IN SEMISOLIDS VIA ESR 3 using the ESR technique in determining the correlation time, 'r (and hence the viscosity, (8) as seen via the Debye-Stokes equation 4 •r r3• 3 kT' a preliminary estimate of Xl as presented in this paper may be made more simply by comparing the relative heights of peaks 1, 2 and 3. It had been noted previously that for biological samples the ratio of peak-to-peak heights of lines 1 and 3, I•/I 3, at a given temperature could yield a fairly reliable measure for relative viscosities (9). MATERIALS AND METHODS Preliminary ESR measurements were made on two spectrometers, operating at X-band (9.5 x 10⁹ Hz) and Q-band (33.8 x 10⁹ Hz) microwave frequencies. Detailed mea- surements were subsequently made at the X-band frequency using a BrOker spectrom- eter (Model ER 200D) and a variable temperature accessory. Samples for ESR measure- ments were prepared by mixing 1 I.•L of DBNO with 1 mL of the ointment base and heating the mixture to slightly above its melting point before being drawn into stan- dard melting point capillary tubes via capillary action. A standard microwave cavity (TE•o 2) was used. It may be noted, however, that in general the use of capillaries and heating of the sample are not required. The probe may be added during the ointment preparation, as discussed later. All spectrometer parameters, e.g., microwave power, microwave frequency, sample temperature, magnetic field scan, modulation ampli- tude and frequency, scan rate, etc., were optimized for best signal-to-noise ratio without signal distortion. The ESR spectra were recorded with a 100-kHz magnetic field modulation frequency unit and care was taken to employ low modulation ampli- tude to avoid line shape distortion. The sample temperature was controlled to within ---0.5øC and varied in 1 ø steps. RESULTS AND DISCUSSION Table I shows literature data for the molecular weights of PEG 1500 which is reported to be in the range of 550 --- 50 and PEG 6000 at around 6000. Thus, at a given temperature the viscosity of PEG 6000 was expected to be significantly higher than that of PEG 1500. Figure 2 represents the ESR spectra of DBNO in PEG 1500 and PEG Table I Physical Characteristics of Ointment Bases Base Viscosity Average Melting Point (Cks) Range Molecular TøC Range 210øF Weight PEG 1500' 38-41 13-18 500-600 PEG 1540' 43-46 25-32 1300-1600 PEG 6000* 60-63 700-900 6000-7500 Petrolatum USP 38-60 - * Obtained from Table of Physical Properties, Carbowax Booklet, Union Carbide Chemicals Co., New York.

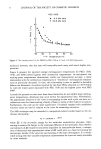
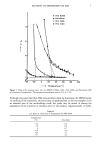
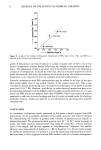
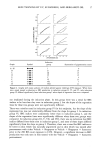
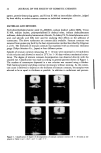
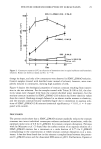
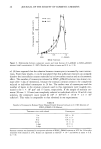
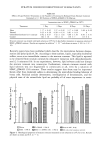
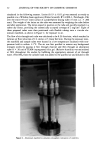
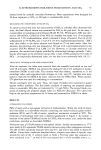
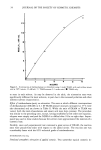
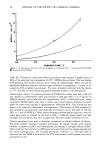
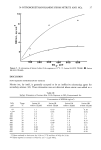
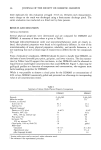
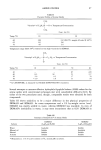
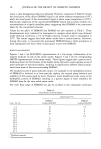
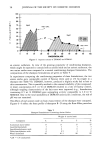
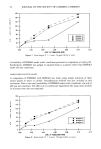
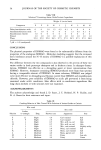
4 JOURNAL OF THE SOCIETY OF COSMETIC CHEMISTS 6000 measured at 25øC, with line 3 shown to be noticeably broader for PEG 6000 than for PEG 1500, in agreement with previously discussed theoretical considerations. Ad- ditional tests based on changing the sample temperature confirmed that broadening of peak 3 was related to phase fluidity. Figure 3 shows the typical X-band spectra for DBNO in PEG 6000 at 87, 37, and - 3øC, taken after sample temperature equilibra- tion for 30 rain at each temperature. The expected increase in broadening of line 3 becomes evident with a decrease in temperature and resultant increased viscosity. Again, theoretical considerations (8,9) indicate that if I•/I 3 data for the X-band (Figure 2) and Q-band measurements are plotted on the same temperature scale, then the Q- band (higher frequency) curve would be expected to correspond to the higher I•/I 3 values. This was indeed confirmed as may be noted from Figure 4. Figure 5 shows a plot of the intensity ratio I•/I 3 as a function of temperature for the four semisolid bases studied. It is observed that with the lower molecular weight PEG 1500 and petrolatum, the ratio I•/I 3 approaches unity at their reported melting-point temper- atures (Table I) since the probe molecule is entirely free to undergo Brownian diffusion in the then liquefied base. It should be noted that PEG 1500, which represents an equal blend of PEG 300 and PEG 1540 (Union Carbide), is said to demonstrate the "consis- tency of petrolatum." Our data in Figure 5 show the relatively close proximity between the curves of these two substances when their I•/I 3 ratios were plotted against TøC in agreement with this descriptive statement. 1 •EG PEG 15OO• ! 12,330 ESR SPECTRA i T ß 25øC 3 ß 1.24 i i 12,380 12,430 Mognetic Field/Gouss Figure 2. ESR spectra for DBNO in PEG 6000 and PEG 1500, illustrating the effect of sample fluidity on the relative heights of the components of the DBNO ESR triplet.
Purchased for the exclusive use of nofirst nolast (unknown)
From: SCC Media Library & Resource Center (library.scconline.org)