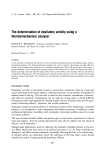
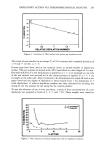
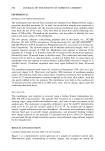
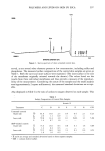
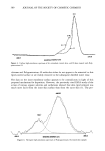
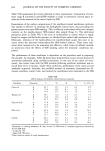
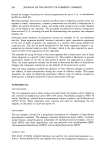
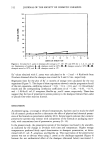
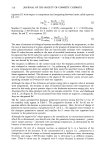
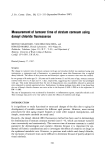
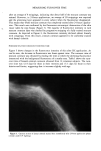
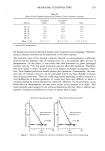
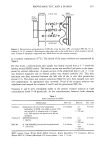
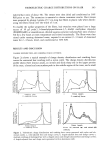
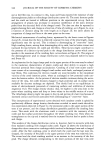
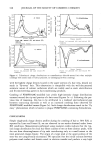
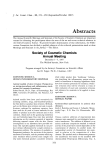
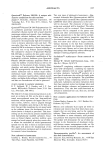
POLYMERS AND LIPIDS ON SKIN BY ESCA 297 Cls 2OOO 01 s I BINDING ENERGY (eV) Figure 1. Survey spectrum of clean unwashed control skin. O.O served, as are several other elements present at low concentration, including sulfur and phosphorus. The measured surface compositions of the control skin samples are given in Table 1. Both the outer and inner surfaces were examined. (The inner surface is the side of the membrane originally oriented towards the dermis.) The values listed are the results from three individual membranes and thus provide a measure of the reproduci- bility of the measurement. Considering the nature of the samples and the small analysis area (approximately 2 square millimeters), the measured standard deviations are accept- able. Als0 displayed in Table I is the ratio of carbon-to-oxygen observed on each sample. This Table I Surface Composition of Control Skin Samples Atomic % Treatment C O N S P Si C/O Untreated controls Outer side Inner side SDSb-washed controls Outer side Inner side 81.0 13.0 2.3 0.4 0.4 2.1 6.23 2.9 1.1 0.9 -- 79.8 13.4 3.0 0.1 N.D. 1.1 5.96 1.4 0.7 1.0 -- -- -- X 73.4 15.0 8.3 0.8 0.1 1.4 4.89 S 1.2 0.4 0.3 -- -- -- -- X 72.5 16.0 9.0 1.3 0.3 0.4 4.53 S 1.6 1.0 0.2 -- -- -- and S are average and standard deviations based on three separate samples. SDS = sodium dodecyl sulfate.

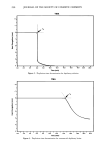
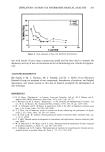
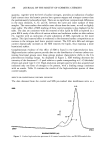
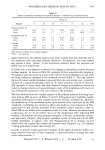
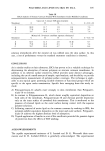
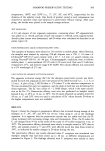
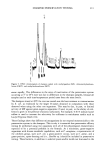
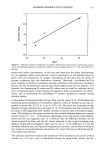
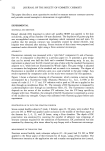
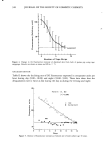
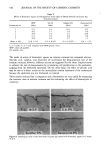
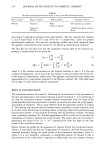
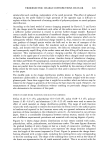
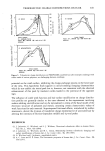
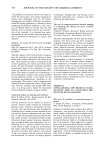
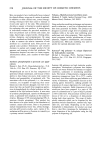
298 JOURNAL OF THE SOCIETY OF COSMETIC CHEMISTS quantity, together with the level of surface nitrogen, provides an indication of surface lipid content since the keratin portion has a greater oxygen and nitrogen content than the predominantly hydrocarbon lipid. There are no significant compositional differences in the main elements, C, O, and N, between the outer and inner surfaces of these samples. The outer surface does exhibit more silicon than the inner, as well as slightly more sulfur. The effect of SDS washing of these control samples is also displayed in the table. The data are consistent with the removal of skin lipids by SDS as reported in a prior ESCA study of the effects of various solvent and surfactant washes on skin surfaces (3), together with an indication of some adsorption of SDS, especially on the inner surface. This lipid removal effect is evidenced in the elemental surface composition as an increase in the nitrogen (and hence protein) content. The C/O ratio falls and nitrogen content dramatically increases as the SDS removes the lipids, thus exposing a more keratinized surface. Complementary evidence of this effect of SDS is found in the high-resolution data. High-resolution carbon spectra provide data on the distribution of various carbon-con- taining functional groups since these groups produce characteristic shifts in the C ls photoelectron binding energy. As displayed in Figure 2, SDS washing decreases the intensity of the dominant C-C peak relative to peaks corresponding to C-O (alcohols/ ethers) and amide type C = O. High-resolution nitrogen spectra were also acquired and indicated only one form of nitrogen to be present, with a binding energy consistent with an amide. Table II contains the results of the high-resolution spectra of these control samples. EFFECTS OF CONDITIONING POLYMER EXPOSURE The data obtained from the control and SDS pre-washed skin membranes serve as a lOOO 299.9 O II N-C C-C c.o /i / 279.9 BINDING ENERGY (eV) Figure 2. Carbon high-resolution spectrum of A) control unwashed skin, and B) SDS-washed skin.
Purchased for the exclusive use of nofirst nolast (unknown)
From: SCC Media Library & Resource Center (library.scconline.org)