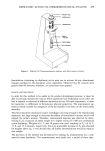
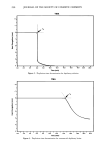
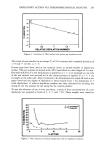
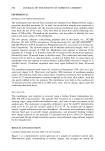
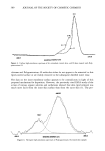
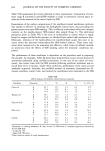
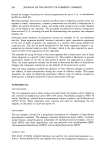
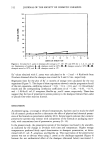
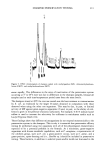
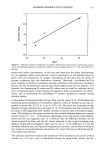
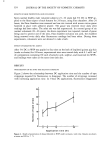
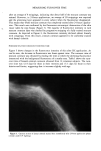
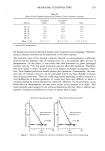
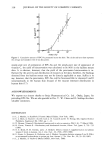
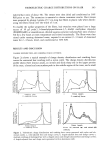
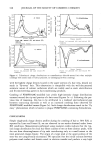
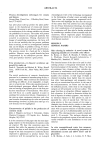
TRIBOELECTRIC CHARGE DISTRIBUTIONS ON HAIR 343 (solvent/hair ratio of about 50). The tresses were then dried and conditioned at 30% RH prior to use. The extraction is essential to obtain consistent results. Hair tresses were prepared by gluing 2 grams of 17-cm-long hair fibers to plastic tabs while distrib- uting the fibers evenly over the width of 3 cm. To modify the surface properties of the fibers, hair swatches were placed into a large excess of 10 g/l poly(1,1-dimethylpiperidinium-3,5,-diallyl methylene chloride) (PDMPDAMC) or stearalkonium chloride aqueous solution (solution/hair ratio of about 50) for a few hours at room temperature and stirred occasionally. The fibers were then rinsed under running deionized water, exposed to an excess (2-3 liters) of deionized water for 2-4 hours, dried, and conditioned at 30% RH. RESULTS AND DISCUSSION CHARGE DISTRIBUTION AND COMBING FORCE PATTERNS Figure 2a shows a typical example of charge density distribution and combing force curves for untreated hair combing with a nylon comb. The charge density distribution profile shows three distinct peaks, an intense and fairly sharp one in the upper portion of the tress, a broad and structureless peak in the middle region of the trees, and a small o • • 0 Combing time 0 -combing force 86a 0 Tress length 0-combing force Tress length O-combing force tSa 0 Tress length First (O),second (•) and third (•) combing Figure 2. Triboelectric charge distributions and combing force curves generated with nylon and alu- minum combs. a, time-adjusted force and charge curves b, length-adjusted force and charge curves c, multiple combings of discharged hair with a charged nylon comb (length-adjusted force and charge curves) d, length-adjusted force and charge curves generated with an aluminum comb.

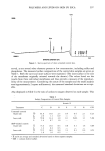
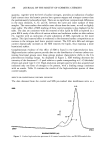
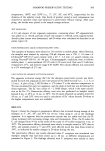
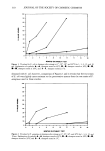
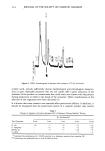
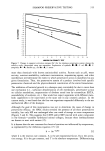
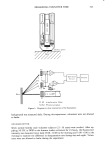
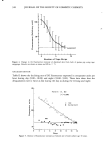
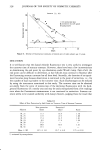
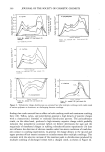
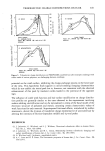
344 JOURNAL OF THE SOCIETY OF COSMETIC CHEMISTS one at the fiber tips. In contrast to this, Lunn and Evans reported the existence of only disentanglement peaks on tribocharge distribution curves (4). The static detector probe and the comb are located at different positions in the experimental set-up. Such an arrangement of sensors was necessary to minimize interference of the static detector probe from the electrical field of the charged comb. The data can thus be reported in graphs showing force and charge as a function of time of combing, as in Figure 2a, or as a function of distance along the tress length as in Figure 2b the latter allows for comparison of charge and force at the same point on the tress. Mechanical measurement of combing forces, represented by the lower curves in Figures 2a and 2b, reveals that the force is relatively constant for most of the tress length, rising significantly near the tip end. This is related to disentangling of "cross-over" hairs. High combing forces, arising from disentangling of tip ends, lead to better contact and increased friction between the comb and the fibers. These factors might contribute to the presence of a distinct tip-end peak in the charge distribution curves which corre- sponds to the maximum of the combing force curves shown in Figure 2b. The origin of the disentanglement peak in charge distribution curves was proposed earlier by Lunn and Evans (4). An explanation for the large charge peak in the upper portion of the tress may be related to the insulation characteristics of plastic combs and their ability to acquire a high electrical potential from charge accumulation. Combing of a hair tress causes contin- uous contact of an increasingly charged comb surface with fresh, uncharged portions of hair fibers. The conditions for electron transfer are most favorable in the immediate vicinity of the comb insertion point, where an uncharged or low potential comb con- tacts the keratin surface. As the process of electron transfer continues during the move- ment of the tress, the comb becomes charged to high potential and its surface states available for electron exchange are depleted. This should lead to an equilibrium in terms of electrochemical potentials of contacting surfaces and inhibition of electron migration (5,6). The charge density should, thus, be highest in the area close to the point where combing starts and drop to lower values in the middle section of a tress. The tribocharge density might rise again in the tip-end portion of a hair tress because of increased contact and friction associated with disentangling of "cross-over" hairs. This interpretation of experimental curves obtained with insulator combs is upheld by qualitatively different charge density distributions recorded in metal-comb electrifica- tion experiments depicted in Figure 2c the prominent peak in the upper portion of the tress is not present, and the charge distribution generally parallels the combing force curve. This result with the aluminum comb is consistent with the constancy of the comb and hair surface potentials throughout the whole combing test. Only when the entanglement at the tip end is reached does the increased friction lead to peaks in force and charge. This analysis of the charge distribution curves is, however, hard to reconcile with data from repeated combing with charged nylon comb. Figure 2d shows the distribution of charge after three consecutive combings which involved a discharged tress and a charged comb. After the first combing, prior to which both the comb and the hair were dis- charged, the intensity of the peak in the upper portion of the tress was relatively low. The second and the third combing resulted in an increase in the intensity of the first peak. The charge densities corresponding to the lower portions of the hair tress were
Purchased for the exclusive use of nofirst nolast (unknown)
From: SCC Media Library & Resource Center (library.scconline.org)