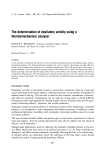
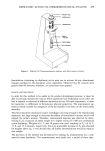
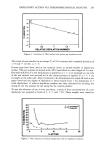
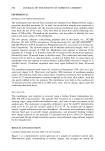
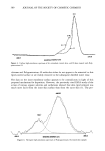
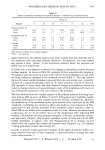
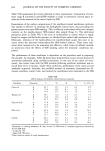
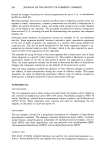
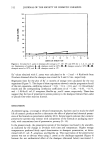
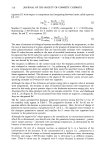
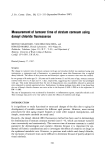
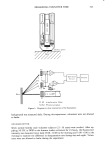
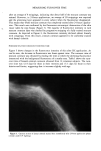
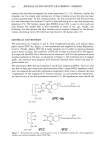
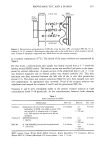
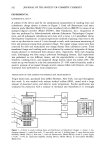
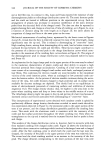
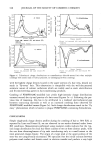
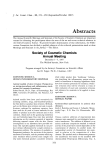
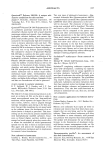
PROVITAMIN TO C AND E IN SKIN 335 icStor.•te•mm! Viable Sk'm •. •Irøcøudlatton Oru I I Delivery I • / IIII System I [ • • " • l-r vt. c l H I, III ' '1 Figure 2. Bioconversion and permeation of EPC-Na across the skin. EPC, provitamin EPC-Na Vt. C, vitamin C Vt. E, vitamin E. Bioconversion takes place only in the viable skin in which esterase is distrib- uted. Vitamin E (lipophilic compound) may diffuse back into the stratum corneum. at a constant temperature (37øC). The details of the assay condition are summarized in Table I. For this study, a full-thickness skin sample was freshly excised from a 5-7-week-old hairless mouse (HRS/J strain). The hairless mouse was sacrificed just prior to the exper- iment by cervical dislocation. A square section of the abdominal skin (3 cm x 3 cm) was removed surgically and its dermal surface was cleaned carefully (16). This skin specimen was then mounted between the half cells of the in vitro skin permeation system (15). The donor and receptor solutions (Table II) were then charged into each cell compartment. At appropriate time intervals, 30 !xl of the receptor solution was withdrawn and assayed for vitamins C and E and the provitamin EPC-Na. Vitamins C and E were remarkably stable in the present receptor solution at high concentration levels (50 !xmole/ml). At low concentrations, however, both vitamins Table I Assay Conditions for HPLC Mobile phase Flow rate Detector Ret. time Vitamin C Ammonium salt (tetra butyl ammonium 2.0 ml/min u.v. 4.8 min hydroxide), 0.002M, was added to water (700 max ml) and pH 5.0, adjusted with 1% formic = 245 nm acid. This solution was mixed with 300 ml methanol. (MeOH/chloroform) = (90/10) Vitamin E 2.0 ml/min u.v. 2.9 min max = 280 nm EPC-Na (0.12M NaH2PO4/acetonitrile/tetrahydrofuran) 2.0 ml/min u.v. 4.4 min = (15/75/10) max = 225 nm HPLC system: Pump, Waters Model 6000A Detector, Kratos Spectroflow 773 Integrator, Spectra- Physics SP4270 Column, IxBondapak C18 (reverse phase), 4 mm x 30 cm.

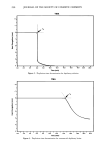
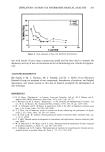
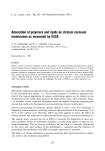
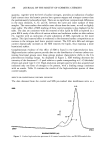
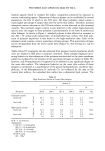
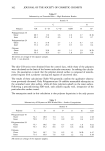
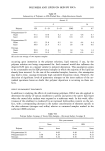
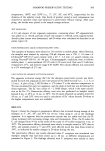
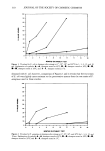
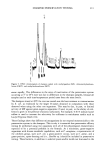
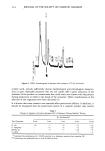
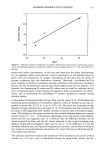
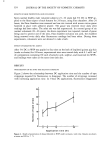
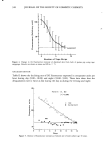
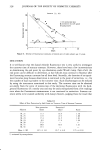
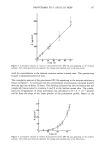
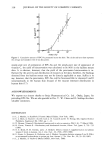
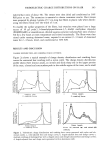
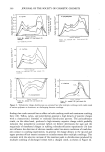
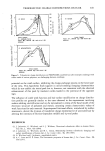
336 JOURNAL OF THE SOCIETY OF COSMETIC CHEMISTS Table II The Donor and Receptor Solutions Used in the In Vitro Skin Permeation Study Drug in donor Drug in receptor Donor solution Receptor solution EPC-Na Vitamin C Water 50% glycerin aq. solution Drug (13 mg/ml) Vitamin E 5 mM Tween-80 aq. solution EPC-Na Water were found to degrade according to first-order kinetics. The rate constants for vitamins C and E were found to be 0.31 and 0.015 (hr-•), respectively, under the present experimental conditions. The intrinsic permeation profiles were then computed from the apparent concentration-time courses by the following mathematical treatment: The flux J(t) per unit skin area and the cumulative amount Q(t) of the vitamins ap- pearing in receptor solution are given by: J(t) = + kC (1) Q(t) = J(t)dt = '•tt + kC dt (2) where C is the vitamin concentration in the receptor solution at time t, k is the rate constant of degradation, and V and A are the volume (3 ml) and surface area (0.64 cm 2) of the receptor compartment, respectively. The apparent concentration-time profile was approximated by a polynomial equation by the Fletcher method (18). The right-hand side of Eqs. (1) and (2) was evaluated analytically. RESULTS AND DISCUSSION The cumulative amount of vitamin C, following the bioconversion of the provitamin in the skin and appearing in the receptor solution is plotted in Figure 3. It is interesting to see that the cumulative amount increased linearly immediately after the onset of the permeation/bioconversion experiment virtually no time lag was observed in the appear- ance profile of vitamin C. This is quite different from the appearance profile of vi:amin E. This finding may indicate that the hairless mouse maintains a certain vitamin C level in its skin tissue which causes a bursting release in the early stage of the permeation and bioconversion profile. It was reported previously that all laboratory animals, including mice, synthesize ascorbate (19). Further experiments will be carried out to elucidate the mechanism of vitamin C permeation across the skin. The steady-state rate of vitamin C appearance was found to be 2.6 X 10 -2 !xmole/cm2/hr from the slope of the time course of the cumulative amount. Figure 4 shows the profile for the appearance of vitamin E from the provitamin biocon- version. It was found that the rate of appearance of vitamin E, after the bioconversion, increased gradually during the entire period of the permeation experiment. Since vi- tamin E is a very lipophilic compound, a considerable amount of vitamin E that is bioconverted in the viable skin is expected to diffuse back into the stratum corneum
Purchased for the exclusive use of nofirst nolast (unknown)
From: SCC Media Library & Resource Center (library.scconline.org)