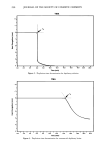
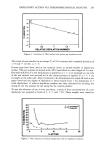
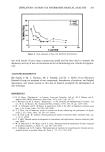
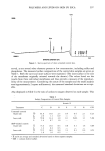
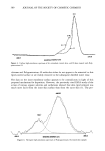
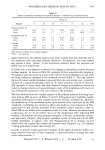
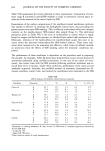
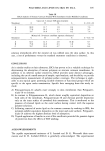
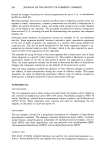
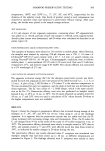
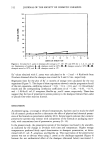
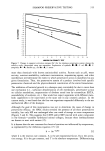
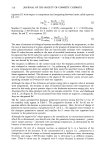
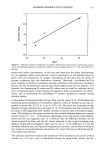
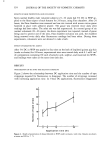
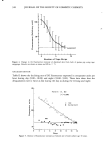
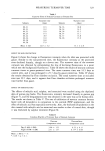
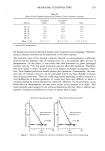
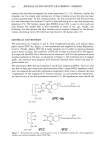
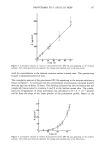
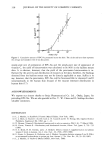
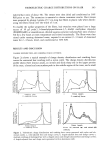
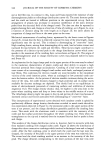
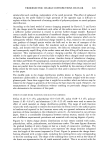
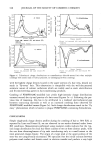
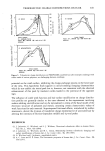
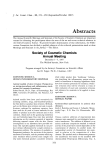
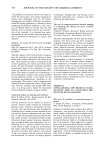
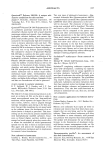
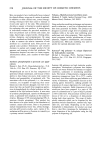
DEPILATORY ACTION VIA THERMOMECHANICAL ANALYSIS 291 o REL:+51VE DEPIL/•TION NUMI•I'SER Figure 4. Correlation of TMA method with guinea pig depilation study. This series of runs resulted in an average Ta of 16.6 minutes and a standard deviation of 1.73 (rsd = 10.4%, n = 7). Guinea pigs have been used at our research center as animal models in depilatory studies. The test animals are shaved with a # 10 razor blade to a hair length of 1.6 min. One-half milliliter of a test formulation is applied to a 5 X 4 cm rectangle on one side of the test animal, and one-half ml of the control product is applied to a 5 X 4 cm rectangle on the other side. After 10 minutes, the formulations are wiped off with a wet paper towel and the degree of depilation is rated visually from 1 (no depilation) to 5 (total depilation). A relative depilation number was then calculated by dividing the rating for the test product by the rating for the control product. To test the relevance of our in vitro procedure, a series of four concentrations of a test depilatory was prepared at levels of 3, 4, 5, and 7.5%. These samples were tested on % ACTIVE *'--'• test compound []--IH thioglycolate 2O Figure 5. Dose responses of sodium thioglycolate and test depilatory solutions.

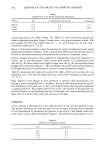
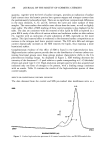
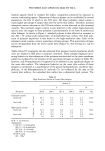
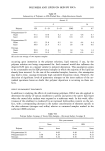
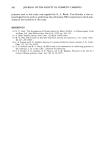
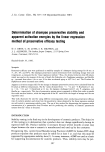
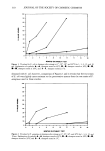
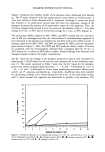
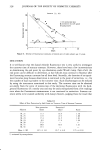
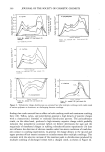
292 JOURNAL OF THE SOCIETY OF COSMETIC CHEMISTS Table I Comparison of T d for Several Commercial Depilatories Product pH % Thioglycolate (as Na salt) Td (Minutes) Roll-on 12.3 6.2 17.4 Cream 12.0 6.0 16.6 Lotion 12.3 6.1 17.7 guinea pigs and by our TMA method. The TMA Td's were then plotted against the relative depilation numbers. Figure 4 shows that a very good correlation results. The least squares fit of the line yields a slope of - 1.72, an intercept of 6.24 min, and a correlation coefficient of - 0.99. Figure 5 shows dose-response curves for solutions of sodium thioglycolate and a newly synthesized depilatory candidate. These curves clearly differentiate the formulas and can be used to determine optimum concentrations for solutions to be further tested. Several commerical products were analyzed for thioglycolate content by iodimetric ti- tration, and Td was determined. Table I shows these results. It is interesting to note that the T•'s for these products are slightly longer than the T•'s for the aqueous sodium thioglycolate solutions in Figure 5. This is probably the result of the lowered solubility of thioglycolate due to the presence of calcium or other formulation variables. Table II summarizes the results of a study of the effect of pH on the activity of a test depilatory active. For the pH range tested, the results show maximum activity at pH 11-11.5. Dose response curves (Figure 6) were generated to examine three formulations con- taining a newly synthesized active candidate. Two gels showed approximately equiva- lent depilatory activity and were, in fact, only slightly slower than the same compound in aqueous solution. This implies that for this active, the viscosity of the gels does not slow the kinetics of the depilatory reaction. Conversely, the cream formulation of the same active was slower than either the solutions or the gels. SUMMARY A new method is described for in vitro determination of the rate of depilatory action. The method detemines the time necessary for hair to begin stretching when immersed in test formulations by measuring the position of one end of a hair bundle under con- stant tension using a thermomechanical analyzer. The method has been shown to corre- Table II pH Effects on Depilatory Activity pH T• (minutes) 10.0 8.2 10.5 6.O 11.0 4.3 11.5 4.3
Purchased for the exclusive use of nofirst nolast (unknown)
From: SCC Media Library & Resource Center (library.scconline.org)