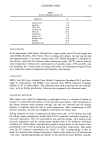
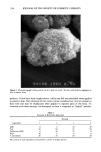
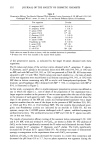
348 JOURNAL OF THE SOCIETY OF COSMETIC CHEMISTS During testing with the linear regression method (8), we noticed that Pseudomonas aeru- ginosa was inactivated more rapidly in nonionic emulsion systems containing carbomer 941 than in products that did not contain this material. By thoroughly studying this system, we developed a method of demonstrating synergy of preservative system com- ponents that uses the rates of inactivation of test organisms determined by the linear regression method. The most desirable outcome of testing antimicrobial preservatives for synergy is finding the combination that will allow the use of fewer and/or reduced concentrations of pre- servatives in consumer products. The use of a preservative system that has synergistic action is of practical significance because it may help reduce the cost of the product and the irritation or sensitization potential of the formula. EXPERIMENTAL TEST ORGANISMS The strains of Pseudomonas used in this study were received directly from the American Type Culture Collection (ATCC) and consisted of P. aeruginosa ATCC strains 9027, 9721, 10145, and 27853 P. cepacia ATCC strains 13945 and 25416 P. fluorescens ATCC 13525 P. putida (Biotype A) ATCC 12633 P. stutzeri ATCC 17588 and Pseu- domonas sp. 9230. P. aeruginosa 9027 routinely is used in antimicrobial preservative testing (1), and P. aeruginosa 27853 is a standardized strain for antibiotic susceptibility testing. Multiple strains of species of P. aeruginosa and P. cepacia were available, and consequently, P. aeruginosa 9027 and P. cepacia 13945 were used unless other strains are indicated. Bacillus cereus ATCC 11778 was obtained directly from the ATCC. E. coli ATCC 8739 was obtained from Hill Top Biolabs, Inc. Staphylococcus aureus ATCC 6538 (FDA 209 strain) and Bacillus sp. were taken from the Jergens culture collection. The cultures were maintained by weekly transfer on Tryptic Soy Agar (TSA). All test organisms were grown on TSA with 0.07% lecithin and 0.5% Tween 80 (TSALT) in 150-mm Petri dishes for 24 hr prior to use in preservative efficacy testing. S. aureus, E. coli, Bacillus sp., and B. cereus were incubated at 37øC. All Pseudomonas test organisms were incubated at 30øC for 24 hr in preparation for preservative efficacy testing. All Petri dishes prepared from samples for determination of aerobic plate counts (APCs) were incubated for 48 hr at 37øC (except for those prepared from samples challenged with both P. cepacia strains and P. fluorescens, which were incubated for 48 hr at 30øC). TEST SAMPLES The test samples used in this study included a nonionic o/w lotion (Table I). The lotion was prepared as follows: Parts A, B, and C were heated to 70øC. Part A was added to part C with continuous mixing. Part B was added after 5 min, and mixing was con- tinued as the batch was cooled to ambient temperature. This lotion was selected for studying the effects of emulsion pH, [polyacrylic acid resin (934 or 941) or acrylic acid copolymer (1342), B.F. Goodrich] neutralizing agent [TEA 99% or 85% (Dow Chem- ical), TEA 99% (Union Carbide), or NaOH], and CaCI•, on antimicrobial activity. The pH readings were adjusted to the stated value ( _+ 0.1 pH unit).

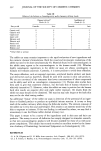
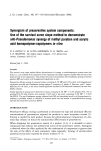
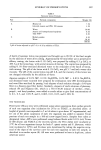
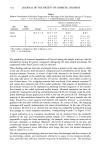
SYNERGY OF PRESERVATIVES 349 Table I Nonionic Lotion Formula Part Formula components Weight (%) A Mineral oil 7.50 Glyceryl stearate and PEG 100 stearate 3.50 B Water 30.00 Acrylic acid homopolymer/copolymer 0.20 TEA 99%* 0.30 C Methyl paraben 0.20 Water 58.30 100.00 * pH of lotion adjusted to pH 7.0 (+ 0.1) by addition of TEA. A batch of nonionic lotion was prepared and brought up to 99.9% of the final weight by the addition of water after cooling. Approximately 60 min before use in preservative efficacy testing, the lotion with 0.1% CaCI 2 was prepared by adding 0.5 g CaCI2 to 499.5 g of the lotion base, with several minutes of mixing. The control was prepared by adding 0.1% filter-sterilized deionized water to the remainder of the batch of lotion, with mixing. The pH of the lotion with 0.1% CaCI 2 was pH 5.7 and had a water-thin viscosity. The pH of the control lotion was pH 6.8, and the viscosity of this lotion was not changed noticeably by the addition of water. Aqueous samples of 0.2% MP, 0.01% Na2EDTA, 0.2% MP q- 0.01% Na2EDTA , and deionized water (control) were prepared for sterilization time (ST) determinations and were filter-sterilized by passing 5-ml aliquots of each solution through a 0.45-lxm filter in a Sweeny-type filter holder. Similarly, aliquots of stock solutions of phenoxy- ethanol (P) and Nipastat (N), which is a 50:15:10:20 mixture of methyl-, ethyl-, propyl-, and butyl-paraben, were added to sterile saline to give final concentrations of 0, 0.1, 0.5, and 1.0% P, and 0, 0.005, 0.01, 0.05, and 0.10% N. TEST PROCEDURES Preservative efficacy tests were performed using saline suspensions from surface growth of each test organism after incubation for 24 hr on TSALT, as described above. A 1oopful of growth was suspended in 5 ml of saline to give about 107 organisms/ml, and 0. ! ml of the saline suspension of each test organism was added to separate 50-ml portions of each test sample in a 100-ml screw-capped bottle. Samples were taken at designated times APCs were performed using Letheen Broth with 0.01% (v/v) Triton X-100 diluent and TSALT as the recovery system the Petri dishes were incubated at 37øC for all test organisms (except for both P. cepacia strains and P. fluorescens, which were incubated at 30øC) and D-values were determined by taking the negative recip- rocal of the slope of the survivor curve for each test organism in each test sample, as described in an earlier report (8). All tests were performed at least in duplicate, unless otherwise stated.
Purchased for the exclusive use of nofirst nolast (unknown)
From: SCC Media Library & Resource Center (library.scconline.org)