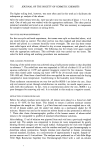
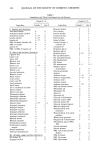
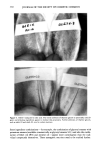
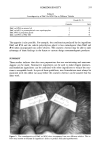
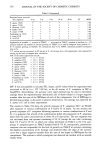
356 JOURNAL OF THE SOCIETY OF COSMETIC CHEMISTS Table V (Continued) Deionized water (control): Test organism 0 hr 2 hr 4 hr 24 hr 48 hr ST MPST P. cepacia 13945 + + + + + -- 48 P. cepacia 25416 + + + + + -- 48 P. fluorescens 13525 + + + + + -- 48 P. putida 12633 + + + + + -- 48 P. stutzeri 17588 + + + + + -- 48 Pseudomonas sp. 9230 + + + + + -- 48 S. aureus 6538 + + + + + -- 48 E. coli 8739 + + + + + -- 48 Explanation of symbols: +, growth on TSALT -, no growth on TSALT numbers in brackets (i.e., [1] and [2]) indicate the number of colonies growing on TSALT [s] is used to designate scant growth (i.e., 8-15 colonies growing on TSALT). ST, sterilization time in hr. MPST, minimum possible sterilization time in hr. * P. stutzeri was not recovered, so ST was set at 0.1 hr because this is the approximate time required for setting up the series of samples after inoculation. APC of the saline suspensions inocula: P. aeruginosa 9027 = 1.1 X 10⁷/ml. P. aeruginosa 9721 = 1.8 X 10⁷/ml. P. aeruginosa 27853 = 1.5 X 10⁷/ml. P. aeruginosa 10145 = 2.0 X 10⁷/ml. P. cepacia 13945 = 1.7 X 10⁷/mi. P. cepacia 25416 = 9.9 X 10⁶/ml. P. fluorescens 13525 = 1.6 X 10⁷/ml. P. putida 12633 = 1.6 x 10⁷/ml. P. stutzeri 17588 = 1.7 x 10⁷/ml. Pseudomonas sp. 9230 = 6.3 x 10⁶/ml. S. aureus 6538 = 1.4 x 10⁷/ml. E. coli 8739 = 6.3 X 10⁶/ml. MP. It was not possible to calculate STs, slopes, and D-values when the organisms were recovered at 48 hr (i.e., ST 48 hr), as for all strains of P. aeruginosa in MP or Na2EDTA. Nevertheless, the survivor curve slope method may be used to determine synergy when the experimentally determined rate of death (slope) is a larger negative number than the sum of the MPSlopes of each of the components. Use of MPSlopes in determining synergy is discussed in greater detail below. No synergy was observed for S. aureus or E. coli in these experiments. The results in Table VII show the growth response of P. aeruginosa 9027 on TSALT after exposure to various combinations of P and/or N in saline. As one reviews the growth responses of P. aeruginosa following exposure to various combinations of P and N, it is apparent that several of the combinations killed the population of P. aeruginosa faster than the same concentrations of either N or P used alone. The test organism was not recovered from test systems containing 0.1% N (except for one tube containing both 1% P and 0.1% N, in which one colony developed on TSALT at the 0 hr sam- pling). P. aeruginosa grew on TSALT streaked with 0.1% N consequently, preservative carryover was not responsible for the lack of growth on TSALT in systems containing the highest concentration of N. Synergy was observed when the slope of the survivor curve was a larger negative number than the sum of the slopes (or MPSlopes) for the components. The systems in which synergism was observed are marked with an asterisk (Table VIII).

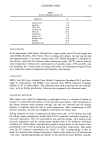
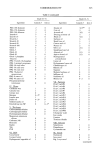
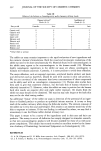
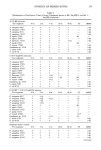
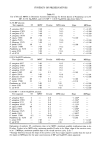
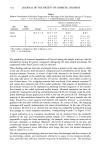
SYNERGY OF PRESERVATIVES 357 Table VI Use of STs and MPSTs to Determine Antimicrobial Synergy for Several Species of Pseudomonas in 0.2% MP, 0.01% Na2EDTA, and 0.2% MP q- 0.01% Na2EDTA (data from Table V) 0.2% MP solution: Test organism ST MPST D-value MPD-value Slope MPSlope P. aeruginosa 9027 -- 48 -- 9.5 -- - 0. 105 P. aeruginosa 27853 -- 48 -- 9.3 -- - 0. 108 P. aeruginosa 9721 -- 48 -- 9.1 -- - 0. 109 P. aeruginosa 10145 -- 48 -- 9.1 -- - 0.110 P. cepacia 13945 48 -- 9.2 -- - 0. 109 -- P. cepacia 25416 -- 48 -- 9.6 -- - 0. 104 P. fluorescens 13525 -- 48 -- 9.2 -- - 0. 108 P. putida 12633 48 -- 9.2 - 0.108 -- P. stutzeri 17588 -- 48 -- 9.2 -0. 109 Pseudomonas sp. 9230 -- 48 -- 10 - 0.100 S. aureus 6538 -- 48 -- 9.3 -0. 107 E. coli 8739 -- 48 -- 10 - 0. 100 0.01% Na=EDTA solution: Test organism ST MPST D-value MPD-value Slope MPSlope P. aeruginosa 9027 -- 48 -- 9.5 -- - 0. 105 P. aeruginosa 27853 -- 48 -- 9.3 -- - 0. 108 P. aeruginosa 9721 -- 48 -- 9.1 -- - 0.109 P. aeruginosa 10145 -- 48 -- 9.1 -- - 0.110 P. cepacia 13945 48 -- 9.2 -- -0. 109 -- P. cepacia 25416 -- 48 -- 9.6 -- - 0. 104 P. fluorescens 13525 -- 48 -- 9.2 -- - 0. 108 P. putida 12633 48 -- 9.2 -- - 0. 108 -- P. stutzeri 17588 24 -- 4.6 -- - 0.218 -- Pseudomonas sp. 9230 -- 48 -- 10 -- - 0.100 S. aureus 6538 -- 48 -- 9.3 -- -0.107 E. coli 8739 -- 48 -- 10 --• - 0.100 0.2% MP q- 0.01% Na=EDTA solution: Test organism ST MPST D-value MPD-value Slope MPSlope P. aeruginosa 9027 4 -- 0.8 -- - 1.260' -- P. aeruginosa 27853 4 -- 0.8 -- - 1.294' -- P. aeruginosa 9721 24 -- 4.6 -- - 0.219' -- P. aeruginosa 10145 4 -- 0.8 -- - 1.325' -- P. cepacia 13945 48 -- 9.2 -- - 0. 109 -- P. cepacia 25416 2 -- 0.4 -- - 2.498* -- P. fluorescens 13525 2 -- 0.5 -- - 2. 102' -- P. putida 12633 2 -- 0.4 -- -2.602* -- P. stutzeri 17588 0.1 -- 0.02 -- - 52. 304* -- Pseudomonas sp. 9230 24 -- 5.0 -- - 0.200 -- S. aureus 6538 -- 48 -- 9.3 -- - 0. 107 E. coli 8739 -- 48 -- 10 -- - 0. 100 Explanation of symbols: ST, sterilization time in hr MPST, minimum possible sterilization time in hr D-value, D-value in hr MPD-value, minimum possible D-value in hr Slope, slope of the survivor curve, in hr-• MPSlope, maximum possible slope of the virtual survivor curve, in hr-•. * Synergy observed, because the slope of the survivor curve was a larger negative number than the sum of the slopes (or MPSlopes) for the same concentrations of MP and Na=EDTA taken separately.
Purchased for the exclusive use of nofirst nolast (unknown)
From: SCC Media Library & Resource Center (library.scconline.org)