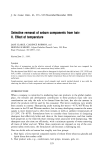
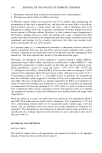
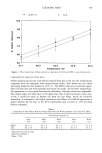
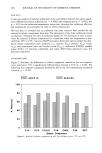
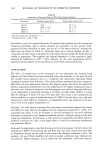
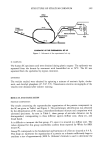
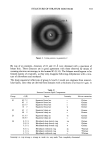
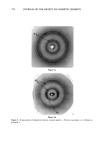
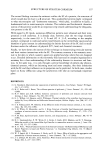
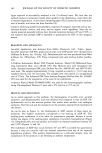
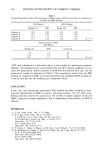
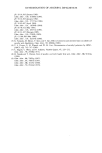
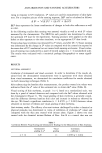
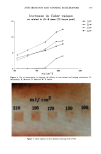
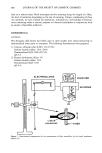
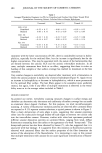
372 JOURNAL OF THE SOCIETY OF COSMETIC CHEMISTS Table II Anti-Irritancy Effect of Product Baseline Treated Control skin color site A site B a* Values 8.65 9.29 13.55 A a* 0.64 4.9 % Decrease in erythema 86.94% pretreated with the prospective anti-irritant. Site A, on the other hand, was treated with the anti-irritant material at a dose of 2 mg/cm 2, 20 minutes prior to application of the irritant. As illustrated in Table II, the efficacy of the anti-irritant in this case is quite clear. Chromameter measurements of both sites were obtained (1) prior to appli- cation of the irritant (baseline) and (2) after development of maximal erythema. Several measurements were taken in order to insure reading the reaction at its maximal point, which occurs about 30-40 minutes after application of the irritant. In addition, at each time point five to six replicates of each measurement were obtained. For the most part, the variance of the replicates is about 0.11 however, if the skin is blotchy, the variance increases slightly (0.18). Therefore, eight to ten replicates were obtained for each mea- surement. As illustrated in Table II, it is possible to quantify the efficacy of a prospective anti-irri- tant ingredient by evaluating the difference in erythema after subtracting baseline values. 4O MeBBuPemen• o• Erythema with CH•IOMAMETEI• ' ' I ' ' ' I ' ' ' I ' •.• •.• 3.=• vJ. su• 1 Figure 1. Erythema: Correlation between visual measurements and chromameter a* values. I I

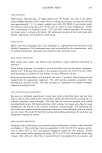
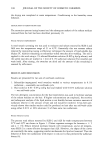
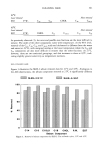
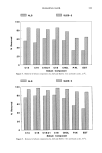
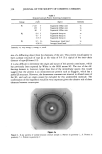
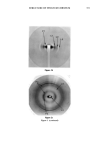
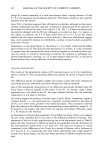
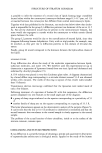
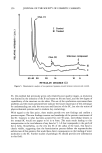
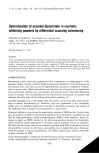
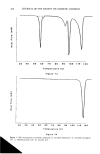
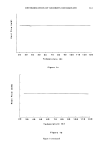
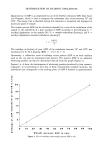
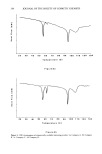
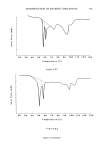
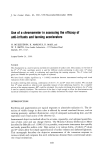
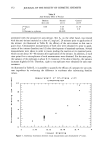
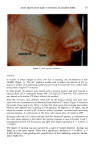
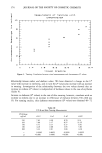
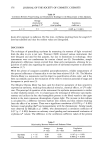
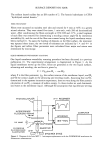
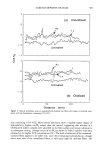
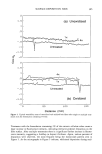
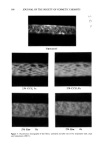
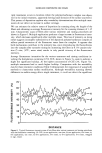
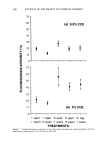
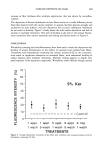
ANTI-IRRITANTS AND TANNING ACCELERATORS 373 control test Figure 2. Anti-irritancy assessment. TANNING In studies to assess changes in skin color due to tanning, the chromameter is also valuable (Figure 3). "Pre-tan" products usually seek to reduce the amount of UV re- quired to achieve skin darkening. Other products seek to extend the time of skin dark- ening from a single UV stimulus. In these studies the subjects were treated with a tanning product and then exposed to varying doses of UV irradiation (range 100-210 mJ/cm 2) (Table III). The control site was treated with similar UV doses without the product. After 48-72 hours, skin darkness values (L*) on the product-treated sites were mea- sured with the chromameter and subtracted from baseline L* values. Figure 4 illustrates the results of one such study. Here it is clear that there was a dose response relationship between skin darkness and increasing UV-B exposure. In addition to L* values, the a* values for redness, as well as b* values for yellow coloration, increased with increasing tanning response. A combination of the three color values were calculated as AE*. Although reflectance (L*) values indicate skin skin darkness/lightness, a combination of the color values appears to best depict the tanning response as seen in Figures 4 and 5. Correlations between UV-B exposure and AE* were highly significant (r = 0.9922, p 0.001). The degree of tanning was also assessed by a panel of trained observers. Scoring was based on a four-point system. There was a significant correlation (r = 0.895%, p 0.001) between visual grading and quantification of skin darkening with the chroma- meter (Table IV).
Purchased for the exclusive use of nofirst nolast (unknown)
From: SCC Media Library & Resource Center (library.scconline.org)