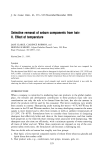
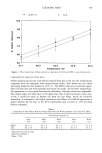
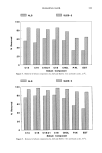
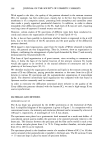
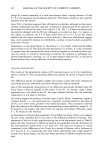
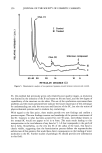
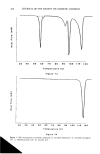
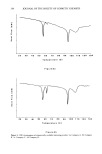
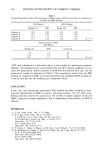
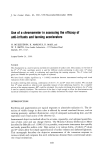
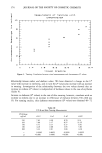
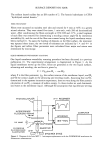
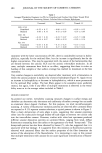
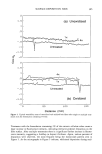
374 JOURNAL OF THE SOCIETY OF COSMETIC CHEMISTS lo I•eaeurement of Tanning w•tla I I I I I I I I I I I I I I [ I I I I I Figure 3. Tanning: Correlation between visual measurements and chromameter L* values. I I Relationship between redness and •rkness values. We have observed a change in the L* value with increase in erythema, and in turn the a* values also increase with an increase in tanning. Investigation of the relationship between the two values showed that an increase in redness (a* values) is independent of darkness values in the case of erythema (Table V). Increase in darkness (L* values) in the case of skin tanning, however, correlates with an increase in redness due to an increase in reflectance of melanin between 550-600 nm (5). For tanning studies, skin darkness measurements (L* values) are obtained 48-72 Table III UV-B and Skin Tanning Measurements UV-B dose mJ/cm 2 /x L* /X a* A b* A E* 210 7.82 4.00 8.76 12.4 195 7.06 3.17 8.57 11.55 170 5.71 0.17 6.17 8.41 130 4.29 0.08 3.95 5.83 106 3.33 0.01 2.66 4.26 r 0.9965 0.8623 0.9924 0.9922 p 0.001 0.0081 0.001 0.001

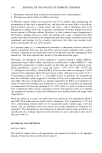
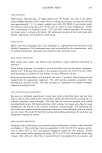
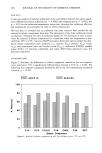
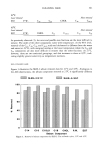
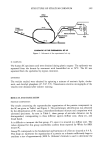
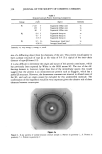
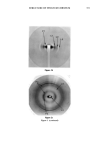
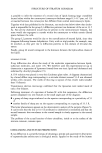
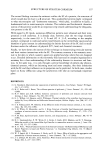
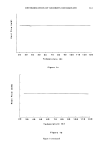
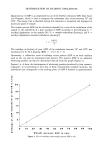
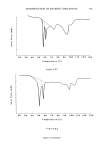
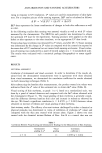
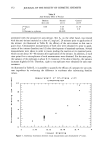
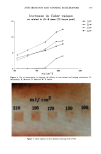
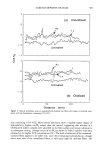
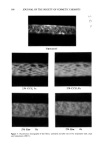
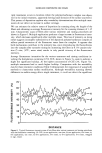
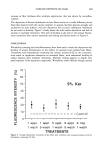
ANTI-IRRITANTS AND TANNING ACCELERATORS 375 15 10 Increase in Color values as related fo UV-B dose (72 hours posf) 00 150 200 250 rnJ/crn^2 Figure 4. Use of chromometer in assessing the efficacy of anti-irritants and tanning accelerators. N. Muizzuddin, K. Marenus, D. Maes and W. P. Smith. mJ cm 2 210 195 170 130 106 Figure 5. Dose response of skin darkness (tanning) with UV-B.
Purchased for the exclusive use of nofirst nolast (unknown)
From: SCC Media Library & Resource Center (library.scconline.org)