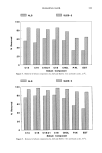
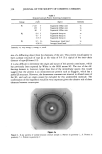
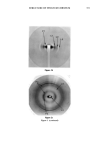
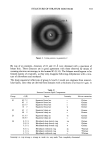
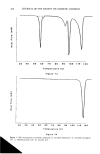
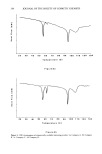
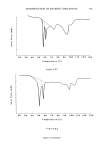
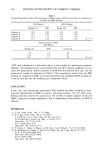
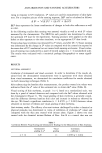
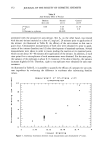
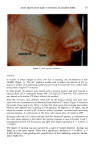
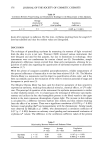
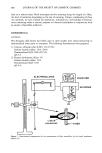
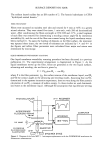
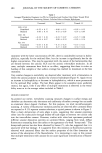
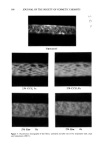
384 JOURNAL OF THE SOCIETY OF COSMETIC CHEMISTS Table I Averaged Wettability Parameter (cos Oa) for Unoxidized and Oxidized Hair Fibers Treated With Formulations Containing Cationic Cellulose Ether or Keratin Hydrolysate Untreated Treated 1 x Treated 4 x CCE: 0.5% Unoxidized -0.22 -+ 0.17 -0.08 -+ 0.15 -0.02 -+ 0.15 Oxidized 0.06 -+ 0.14 0.43 +- 0.05 0.35 +- 0.05 CCE: 2% Unoxidized -0.39 + 0.10 -0.24 + 0.07 -0.23 -+ 0.08 Oxidized -0.16 -+ 0.07 0.08 +- 0.10 -0.03 - 0.16 Ker: 5% Unoxidized -0.43 + 0.10 -0.15 -+ 0.23 -0.15 +- 0.21 Oxidized -0.15 + 0.10 0.27 - 0.09 0.34 -+ 0.14 treatment with the lower concentration of CCE, there is considerable increase in hydro- philicity, especially for the oxidized fiber, but the increase is significantly less for the higher concentration. This may be associated with the nature of the hemimicelles that are formed between the cationic CCE and the anionic ethersulfate molecules. In all cases, multiple treatments have little or no effect, suggesting that there is either no buildup of this complex or that surface coverage has reached its maximum in the first treatment. Very similar changes in wettability are observed after treatment with a formulation in which the cationic polymer is replaced by a keratin hydrolysate (Figure 4). Again we see an increase in hydrophilicity or decrease in hydrophobicity, which is more pronounced for the oxidized fiber surface. The hair fibers appear to be somewhat more uniformly treated, but again, little if any effect of multiple treatments is observed in the wetta- bility scans or in the average values included in Table I. MICROFLUOROMETRY As pointed out earlier, wettability scanning measures changes in surface energy and therefore can determine only the extent and uniformity of surface coverage but can make no statement about deposit thickness. For this purpose, we tried microfluorometric scanning. A variety of fluorescence emission patterns are observed after untreated fibers are exposed to 0.1% aqueous uranine solutions a typical pattern is shown in Figure 5. Here a sharp demarcation of scale edges is seen, suggesting that uranine penetrates either into the endocuticle through broken-off scale edges or between two cuticle cells into the intercellular cement. However, studies with other hair specimens produced different uranine deposition patterns on untreated fibers, ranging from weak, diffuse fluorescence emanating from the surface to the appearance of a weak "honeycomb." This honeycomb pattern has also been observed by Leaver (7), who has suggested that it is associated with hair damage. It is apparent from this variation in fluorescence patterns observed with untreated fibers that the surface properties of the fiber determine the nature of the adsorption of the fluorochrome. It is interesting to note in this context that multiple treatments with uranine do not cause significant intensification of fluores- cence.

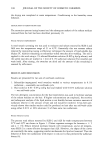
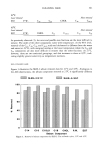
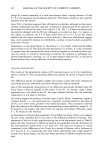
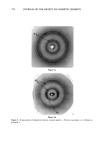
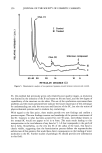
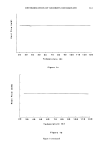
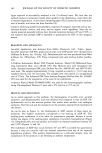
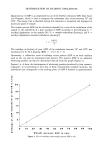
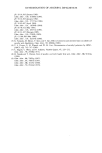
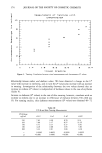
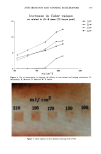
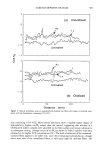
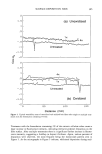
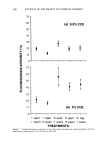
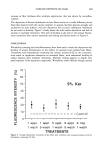
SURFACE DEPOSITS ON HAIR 385 1.5 .5 -.5 -1 -1.5 -2 (a) Unoxidized ß lx _ ' 4x 1.5 .5 -.5 -1 -1.5 -2 4x ß I I I 0 50 loo 150 Distance (mm) Figure 4. Typical wettability scans of unoxidized and oxidized hair fibers after single or multiple treat- ments with the formulation containing 5% Ker. Treatment with the formulation containing 2% of the cationic cellulose ether causes a large increase in fluorescence intensity, indicating extensive polymer deposition on the fiber surface. After multiple treatments there is a significant further increase in fluores- cence intensity, suggesting a buildup in deposit thickness. Again, various patterns of deposition were observed, the most frequent being the honeycomb pattern seen in Figure 5. As the micrographs in Figure 5 indicate, additional deposition during mul-
Purchased for the exclusive use of nofirst nolast (unknown)
From: SCC Media Library & Resource Center (library.scconline.org)