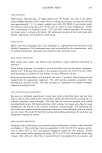
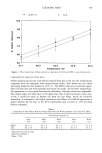
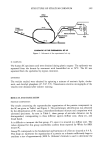
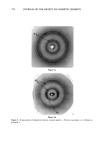
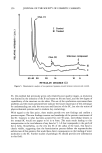
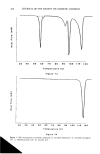
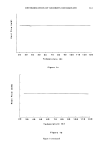
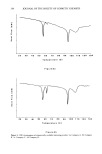
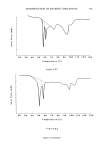
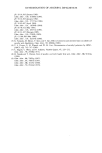
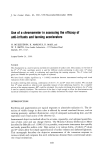
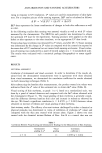
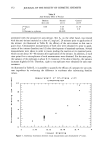
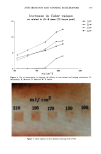
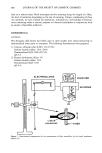
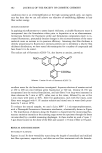
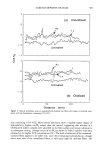
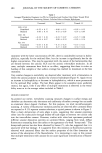
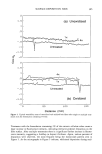
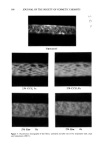
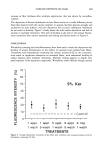
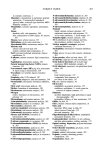
382 JOURNAL OF THE SOCIETY OF COSMETIC CHEMISTS conditions exist is an oversimplification at the high scanning speeds used, our experi- ence has been that we can still achieve our objective of establishing dif)•rences in hair fiber surface energy. MICROFLUOROMETRY In applying microfluorometry to assess deposit thickness, a suitable fluorescent tracer is incorporated into the formulation either prior to deposition or as an aftertreatment. Interactions between the fluorescent probe and formulation components result in in- creased fluorescence, presumably because changes in the microenvironment of the tracer molecule cause an increase in its quantum efficiency. Assuming that film thickness is directly proportional to fluorescence intensity permits one to determine a relative film thickness distribution we have tested this assumption for a number of compounds and have found it to be correct. The sodium salt of fluorescein (CIAY-73), also known as uranine, proved an N, COONa Scheme. Uranine Na salt of fluorescein (CIAY-73). excellent tracer for the formulations investigated. Aqueous solutions of uranine excited at 450 to 490 nm emit brilliant green fluorescence at 540 nm. Uranine (0.1%) was incorporated into the various formulations, and hair fibers 5-cm long were immersed in these solutions for 5 min at 30øC, either once or five times, followed by one or five 1-min rinses with water at 30øC. After five applications, each with five rinses, some fibers were retagged with 0.1% uranine solution and rinsed once in water (both proce- dures for 5 min at 30øC). To evaluate the treated samples, we used a Leitz MPV 1.1 microspectrophotometer, with a Ploemopak fluorescence illuminator attachment, schematically shown in Figure 2. The distribution of deposits along the filament is characterized by monitoring fluo- rescence emission intensity as the scanning stage moves the specimen through the beam circumscribed by a variable measuring diaphragm. In these studies we used a 5-1•m x 5-1•m beam focused on the dome of the fiber and scanned 1.35 mm of fiber at 18 I•m/s. RESULTS AND DISCUSSION WETTABILITY SCANNING Figures 3a and 3b show wettability scans along the length of unoxidized and oxidized hair fiber specimens, respectively, and after one and four treatments with the formula-

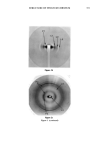
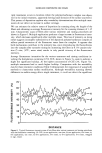
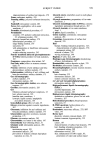
SURFACE DEPOSITS ON HAIR 383 .5 -.5 (a) Unoxidized Untreated .5 -.5 4x Untreated (b) Oxidized I ! I ! I I I ! I 50 '100 Distance (mm) Figure 3. Typical wettability scans of unoxidized and oxidized hair fibers after single or multiple treat- ments with the formulation containing 0.5% CCE. tion containing 0.5% CCE. Most treated specimens show a slightly higher degree of hydrophilicity (higher cos Oa values) than the control, suggesting that residues of a CCE/laureth sulfate complex were adsorbed on the fiber surface and remain substantive to subsequent rinsing. Average values of cos Oa are shown in Table ! together with data obtained at the higher CCE concentration (2%). The level of oxidation of the untreated, oxidized fibers appears to be rather low, since their remaining hydrophobicity, though lower than that of the unoxidized fibers, is still quite high for oxidized fibers. On
Purchased for the exclusive use of nofirst nolast (unknown)
From: SCC Media Library & Resource Center (library.scconline.org)